Situation
Strong held-out accuracy does not reveal when a classifier stops working in production. Teams need evidence of where a model remains reliable, not just a single number.
Data Science
A model-evaluation workbench that measures how classification pipelines behave under missingness, noise, distribution shift, and other real-world stresses.
View source repository↗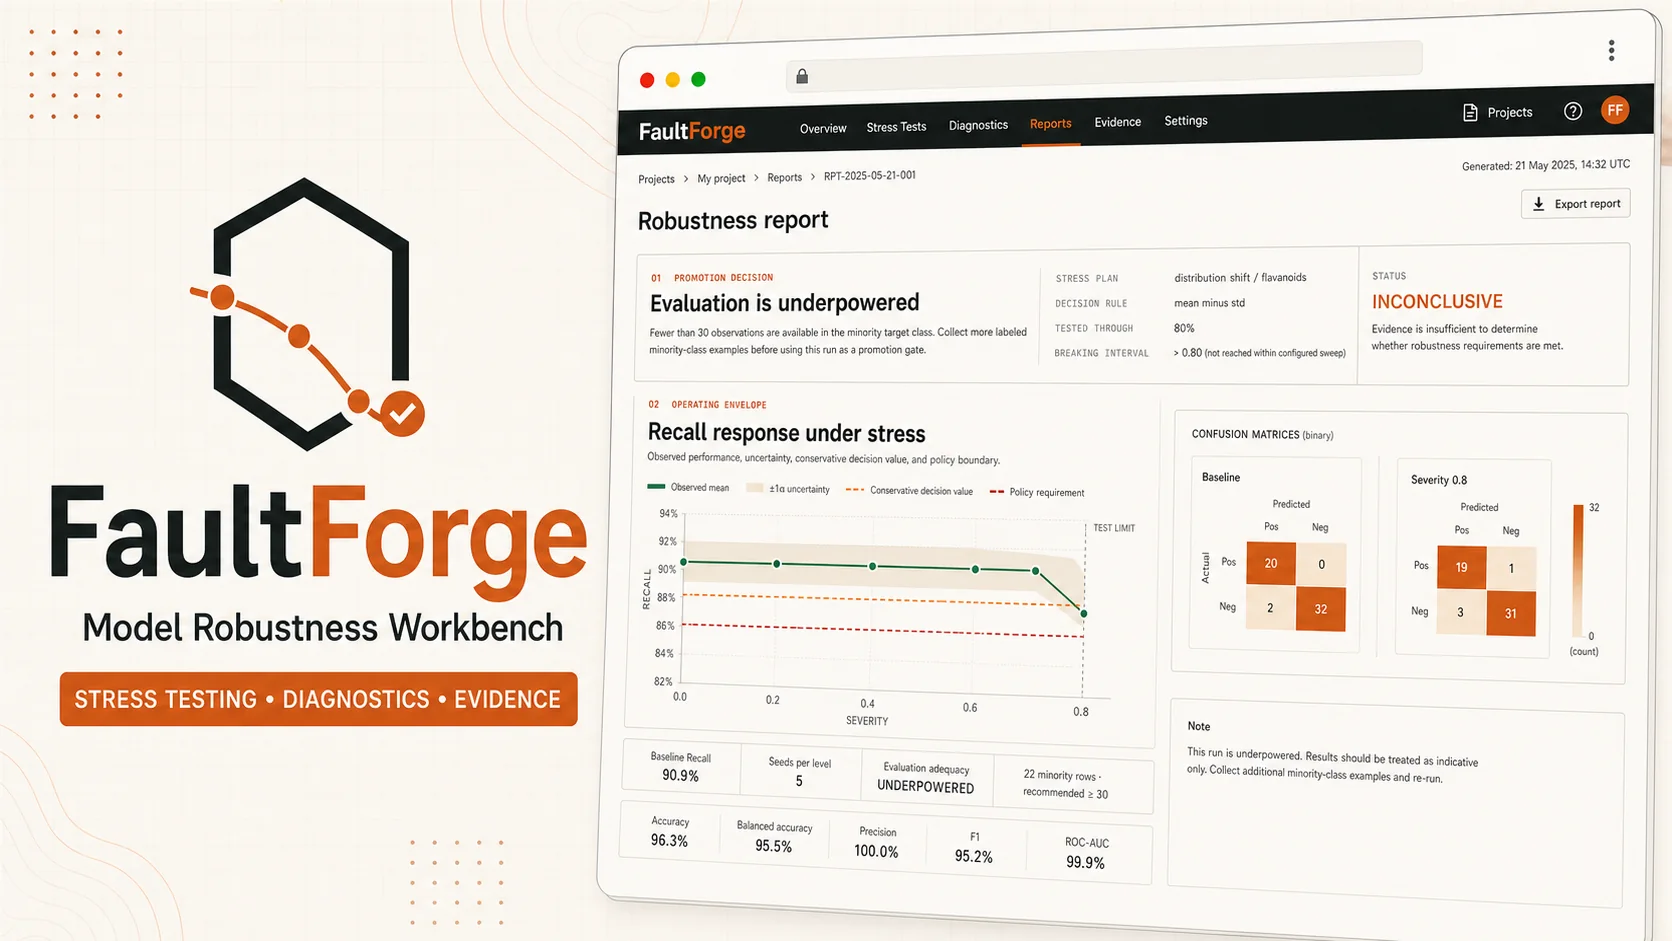
Why it matters
My role
Strong held-out accuracy does not reveal when a classifier stops working in production. Teams need evidence of where a model remains reliable, not just a single number.
Build a model-evaluation workbench that deliberately stresses a classifier with missingness, numerical noise, distribution shift, categorical drift, unseen categories, and prevalence change, then turns the results into reproducible, honest pass or fail evidence instead of false certainty.
Deployment ranges and adequacy rules (fewer than 30 minority-class examples is inconclusive, fewer than 10 is rejected) keep promotion decisions honest. A single accuracy score is replaced with reproducible evidence of exactly where a model remains reliable and where it does not.
Technical implementation
Each layer connects an implementation choice to the decision or workflow it supports.
06 layers| Layer | Implementation | Operational purpose |
|---|---|---|
| Experiment definition | Versioned model artifacts, dataset fingerprints, target semantics, stress plans and metric guards | Make every evaluation reproducible and tied to the exact model and data used |
| Stress generation | Missingness, numerical noise, distribution shift, categorical drift, unseen categories and prevalence change | Measure behaviour under realistic data-quality and population changes |
| Repeated evaluation | Deterministic multi-seed trials with mean, standard deviation, minimum and maximum summaries | Separate stable degradation from one-off variation |
| Statistical evidence | Paired class-stratified bootstrap intervals and conservative guard values | Avoid declaring failure when the observed difference is not adequately supported |
| Diagnostics | Calibration, confusion matrices, probability margins, prediction flips, PSI and compound-stress ablations | Explain how and where model behaviour changes |
| Decision output | Pass, failure, flaky, inconclusive and execution-failure states with JSON and HTML evidence | Translate evaluation results into reviewable promotion decisions |
Product walkthrough
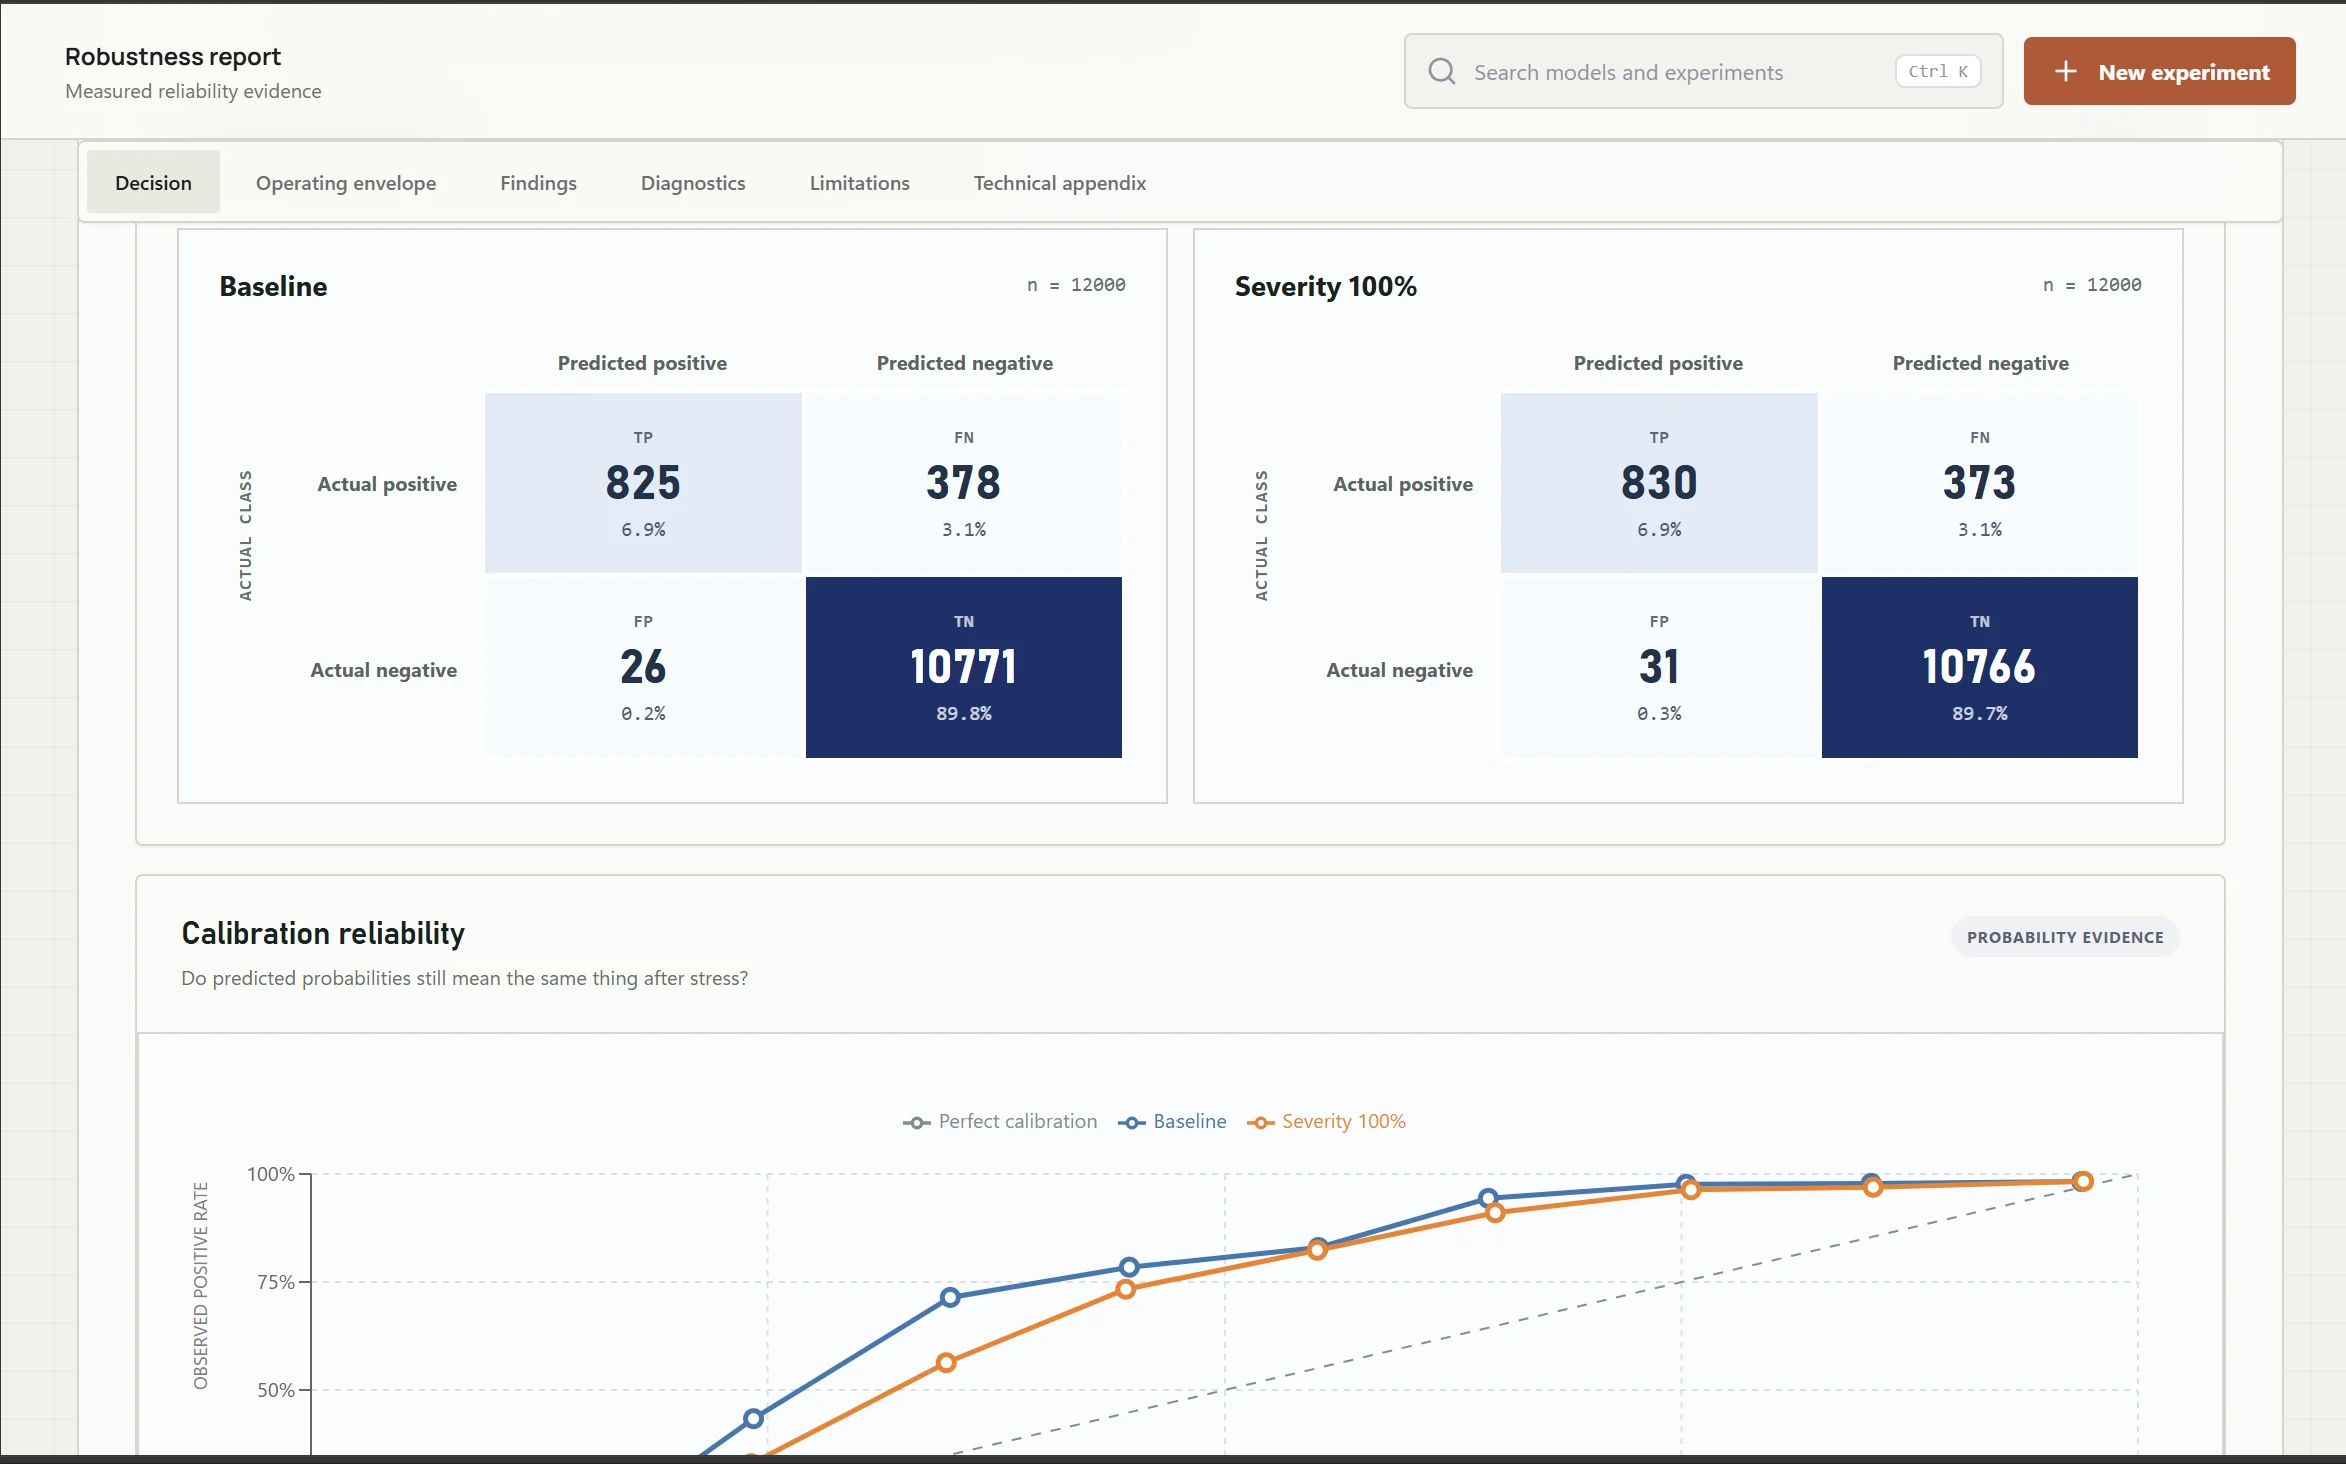
Combines confusion-matrix, calibration, and robustness curves into a single evaluation view.
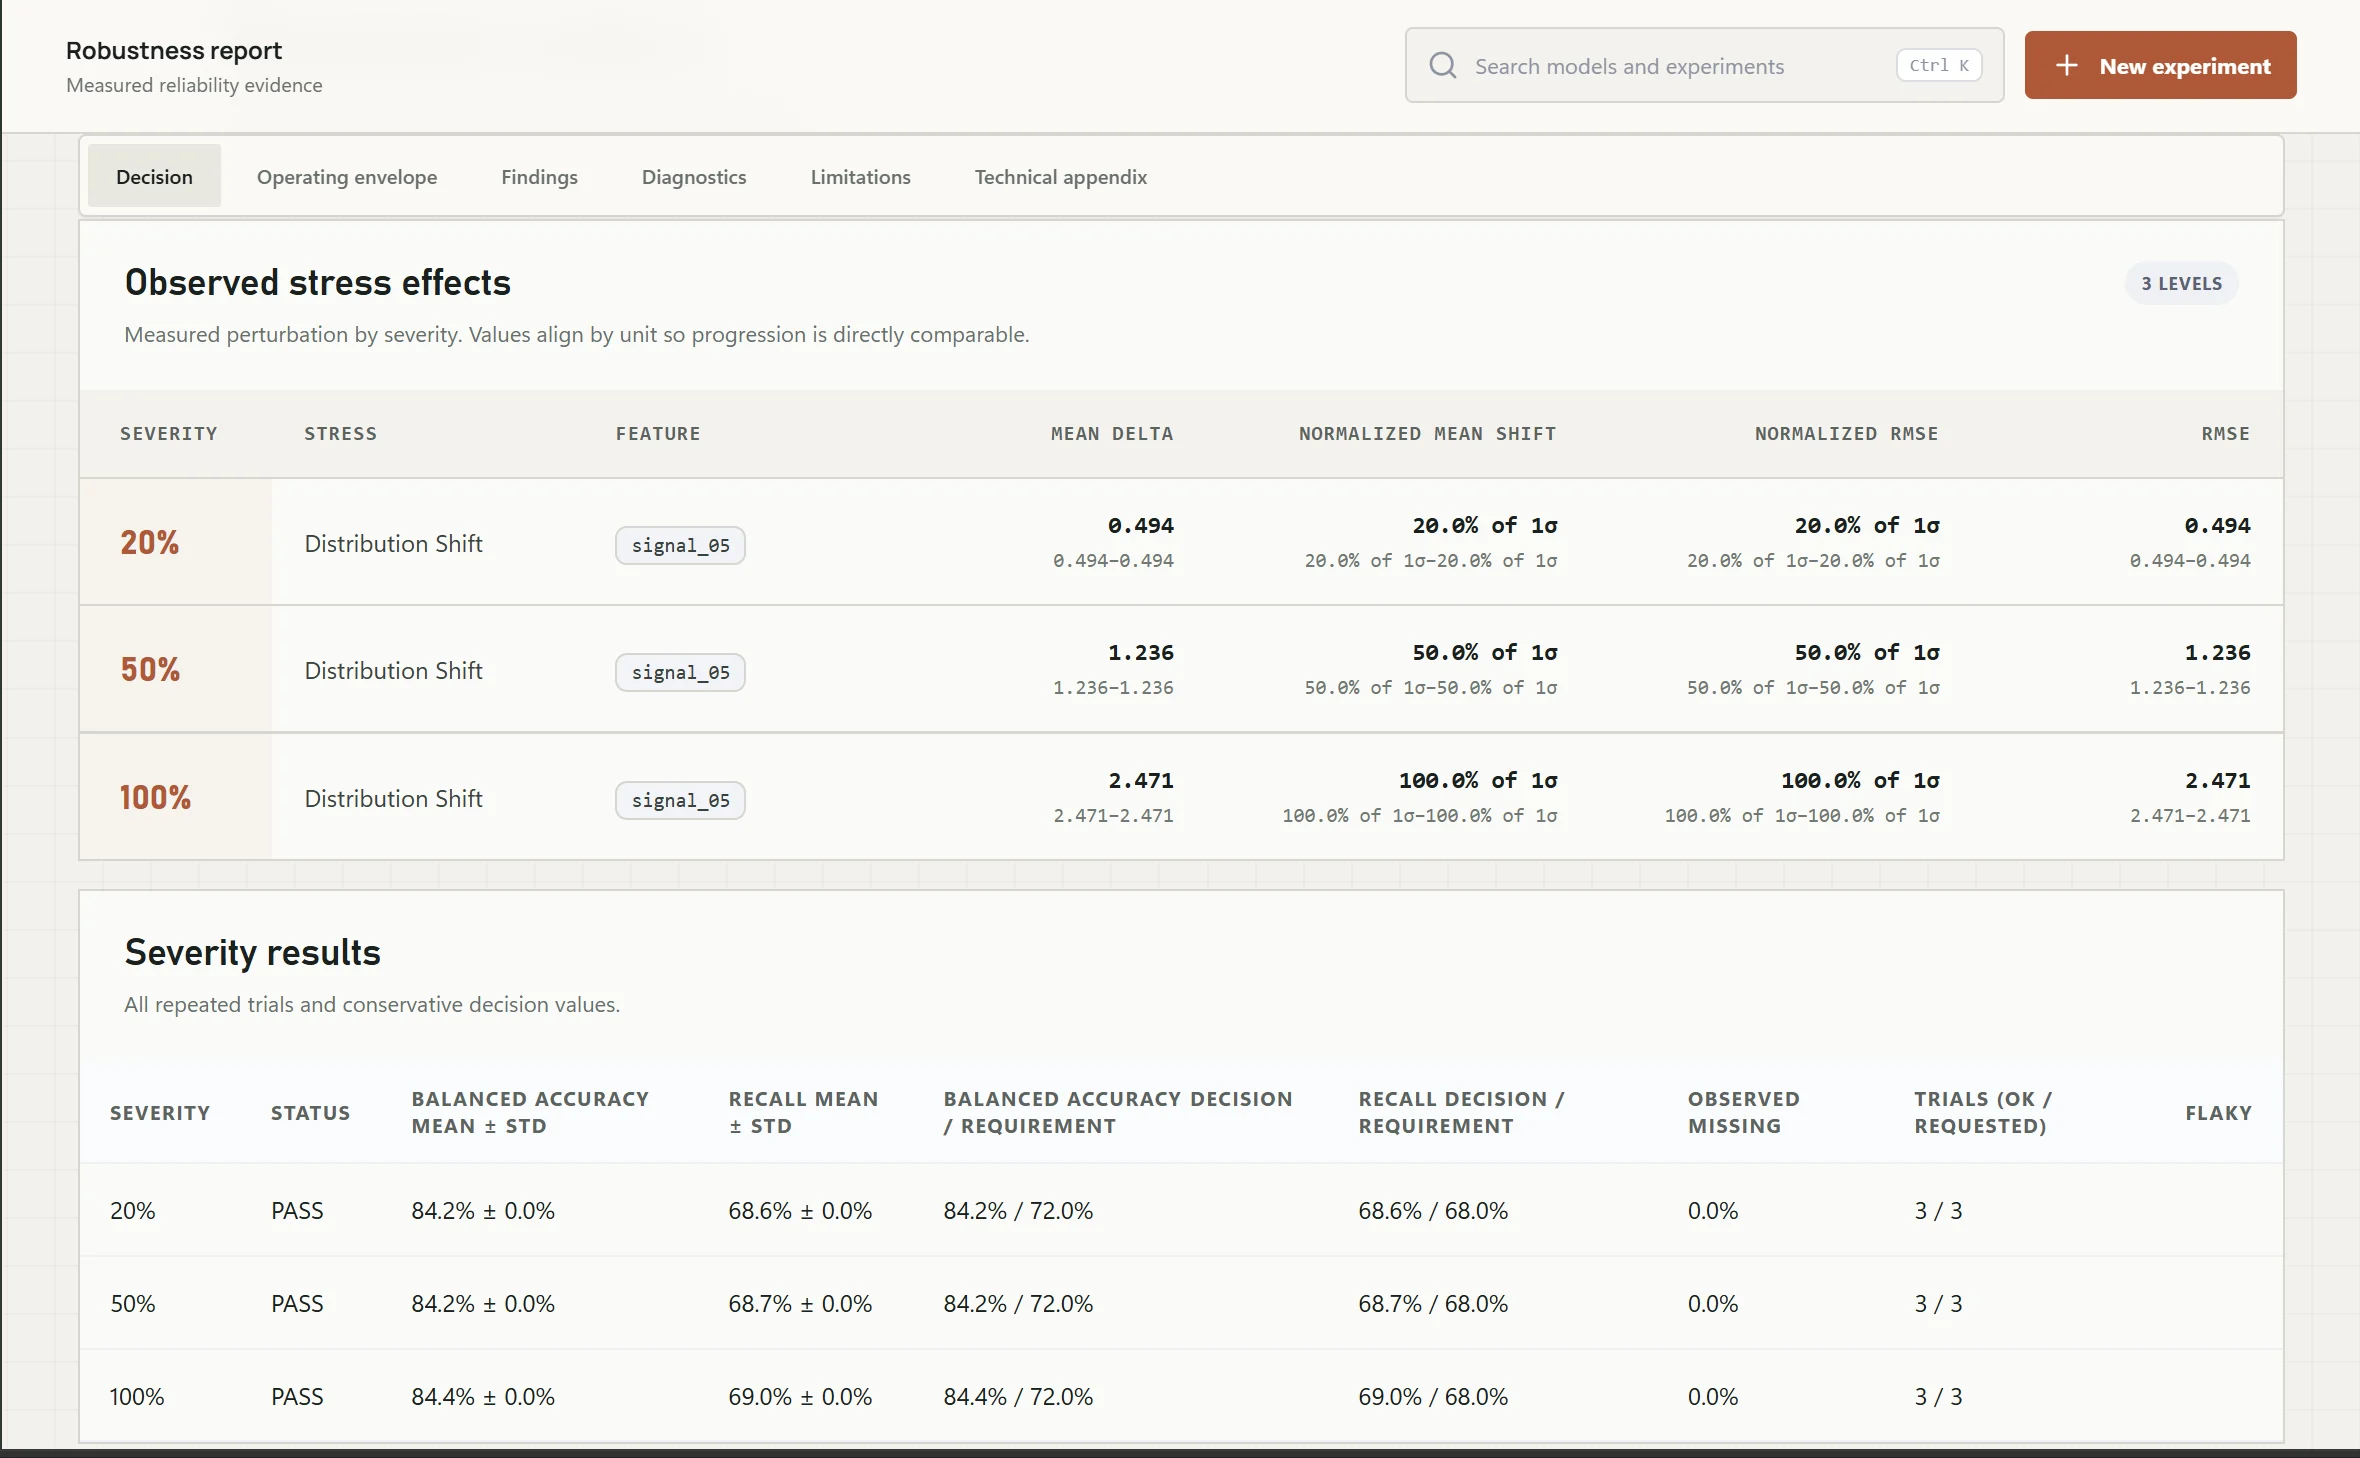
Shows how a metric degrades across increasing stress severity levels, with confirmed breaking points.
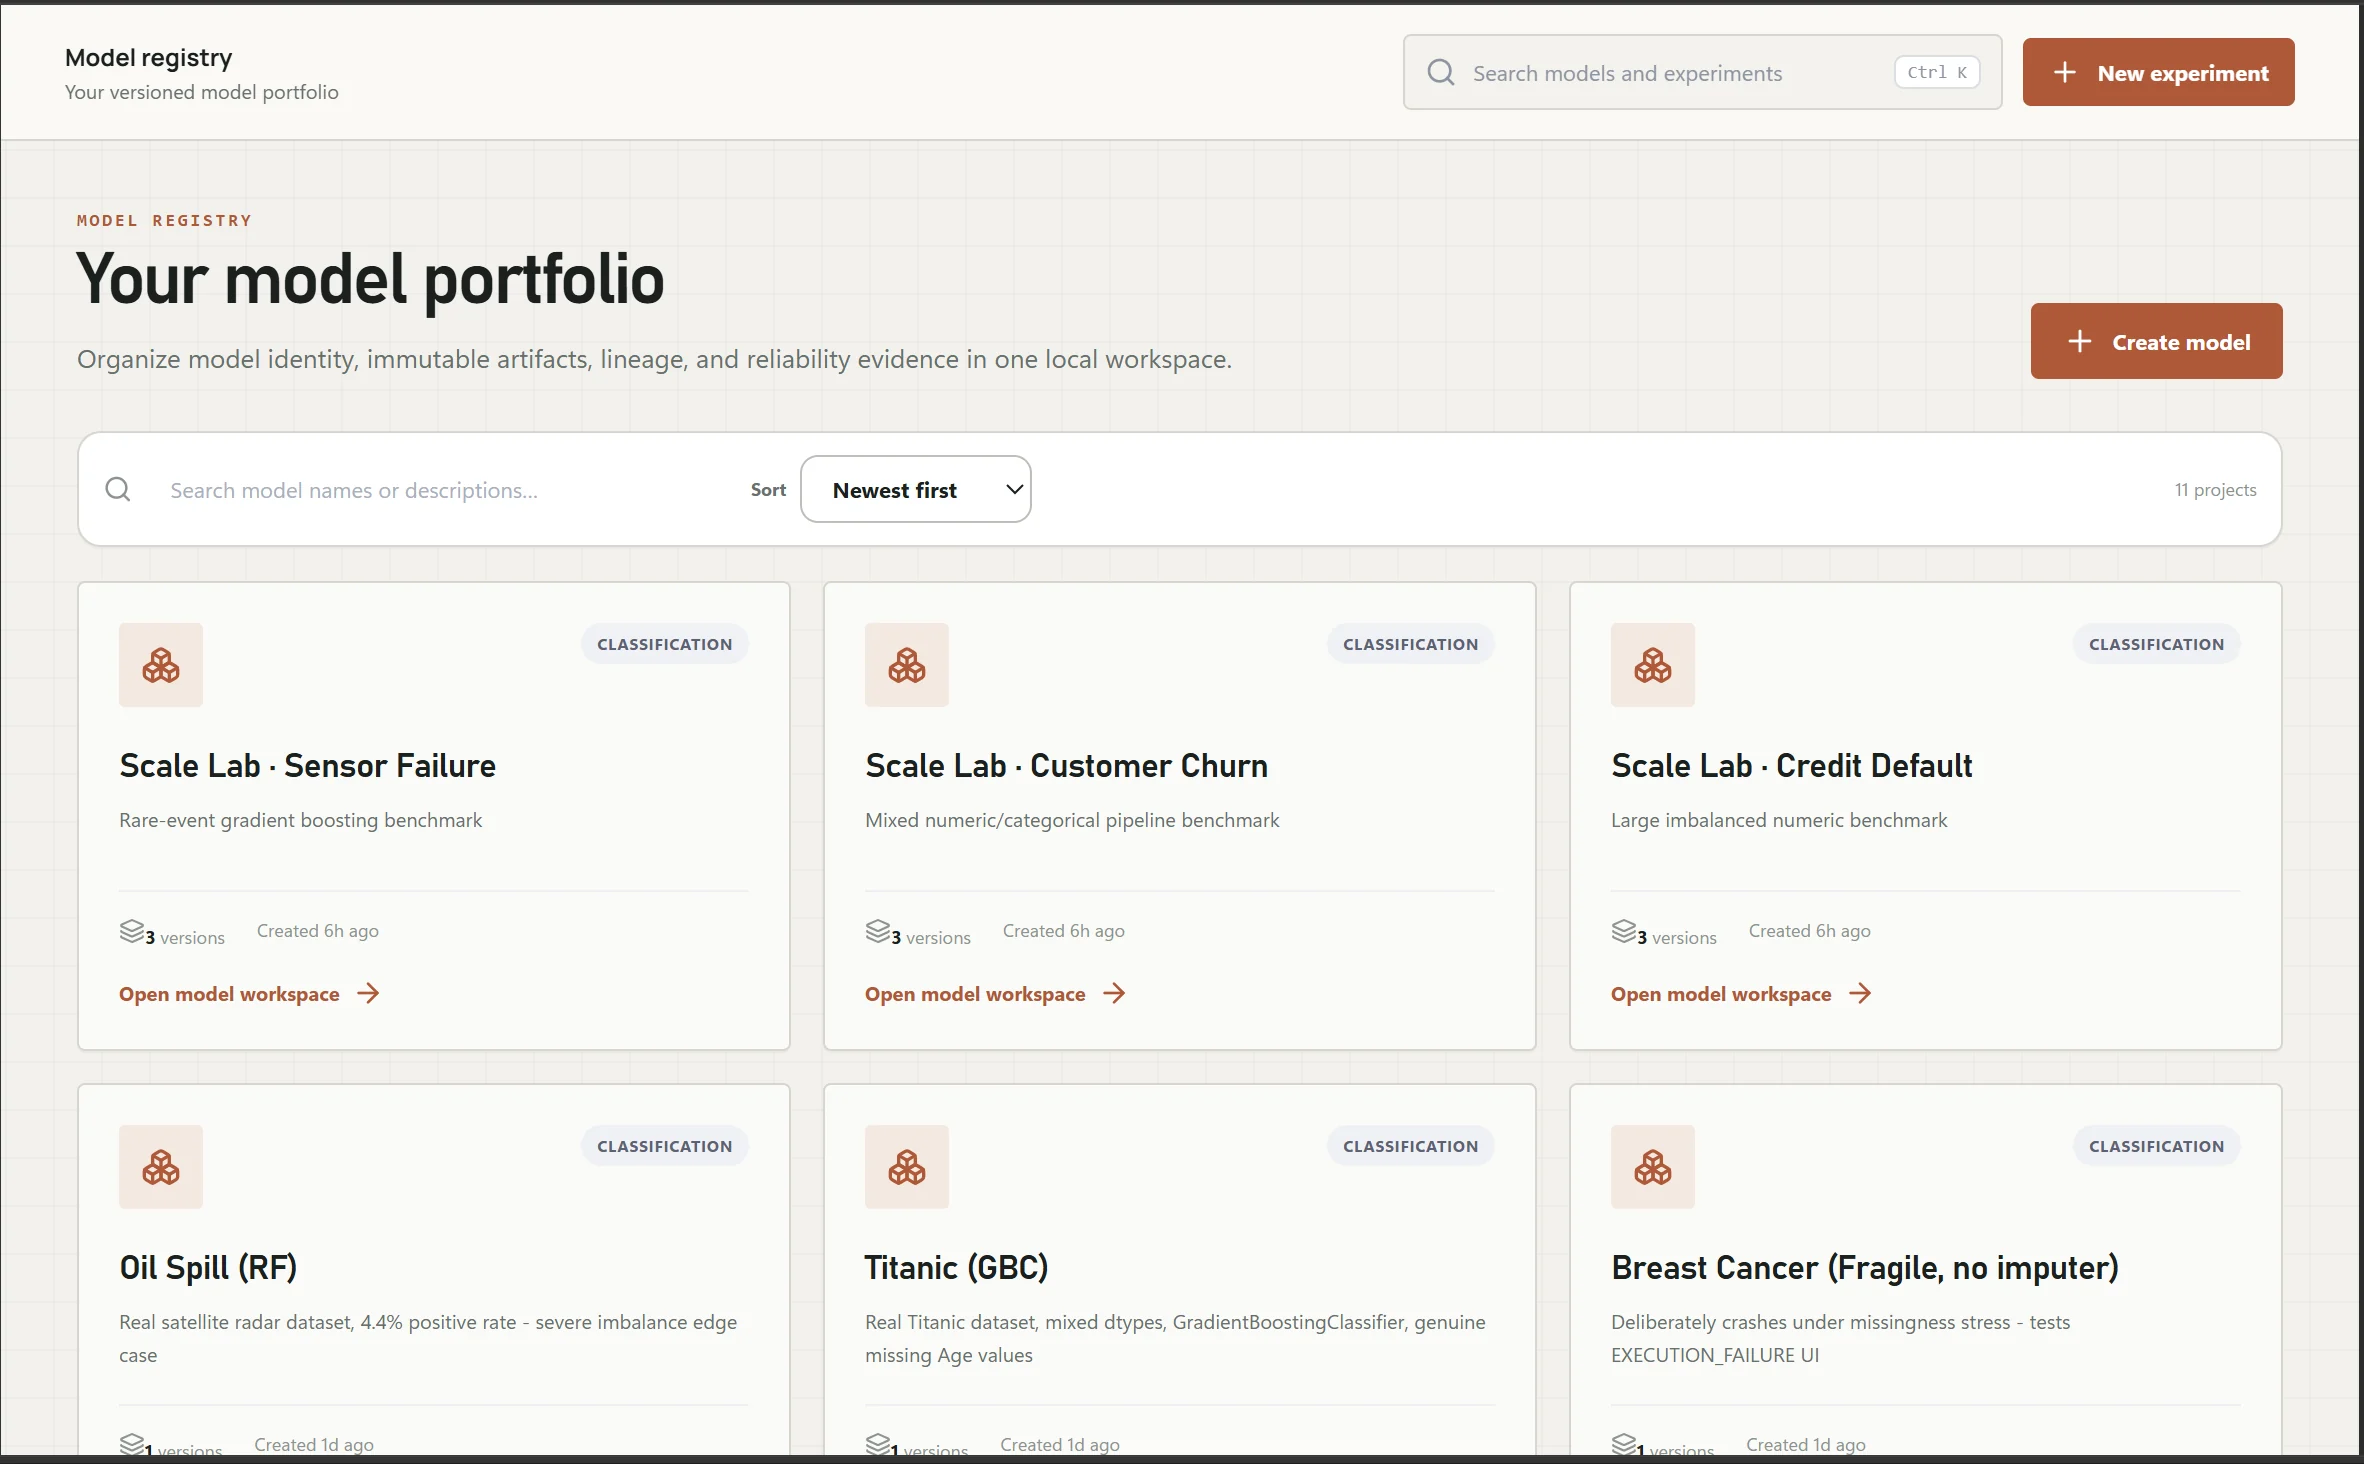
Organizes versioned model assets and keeps lineage and reliability evidence attached to each model.
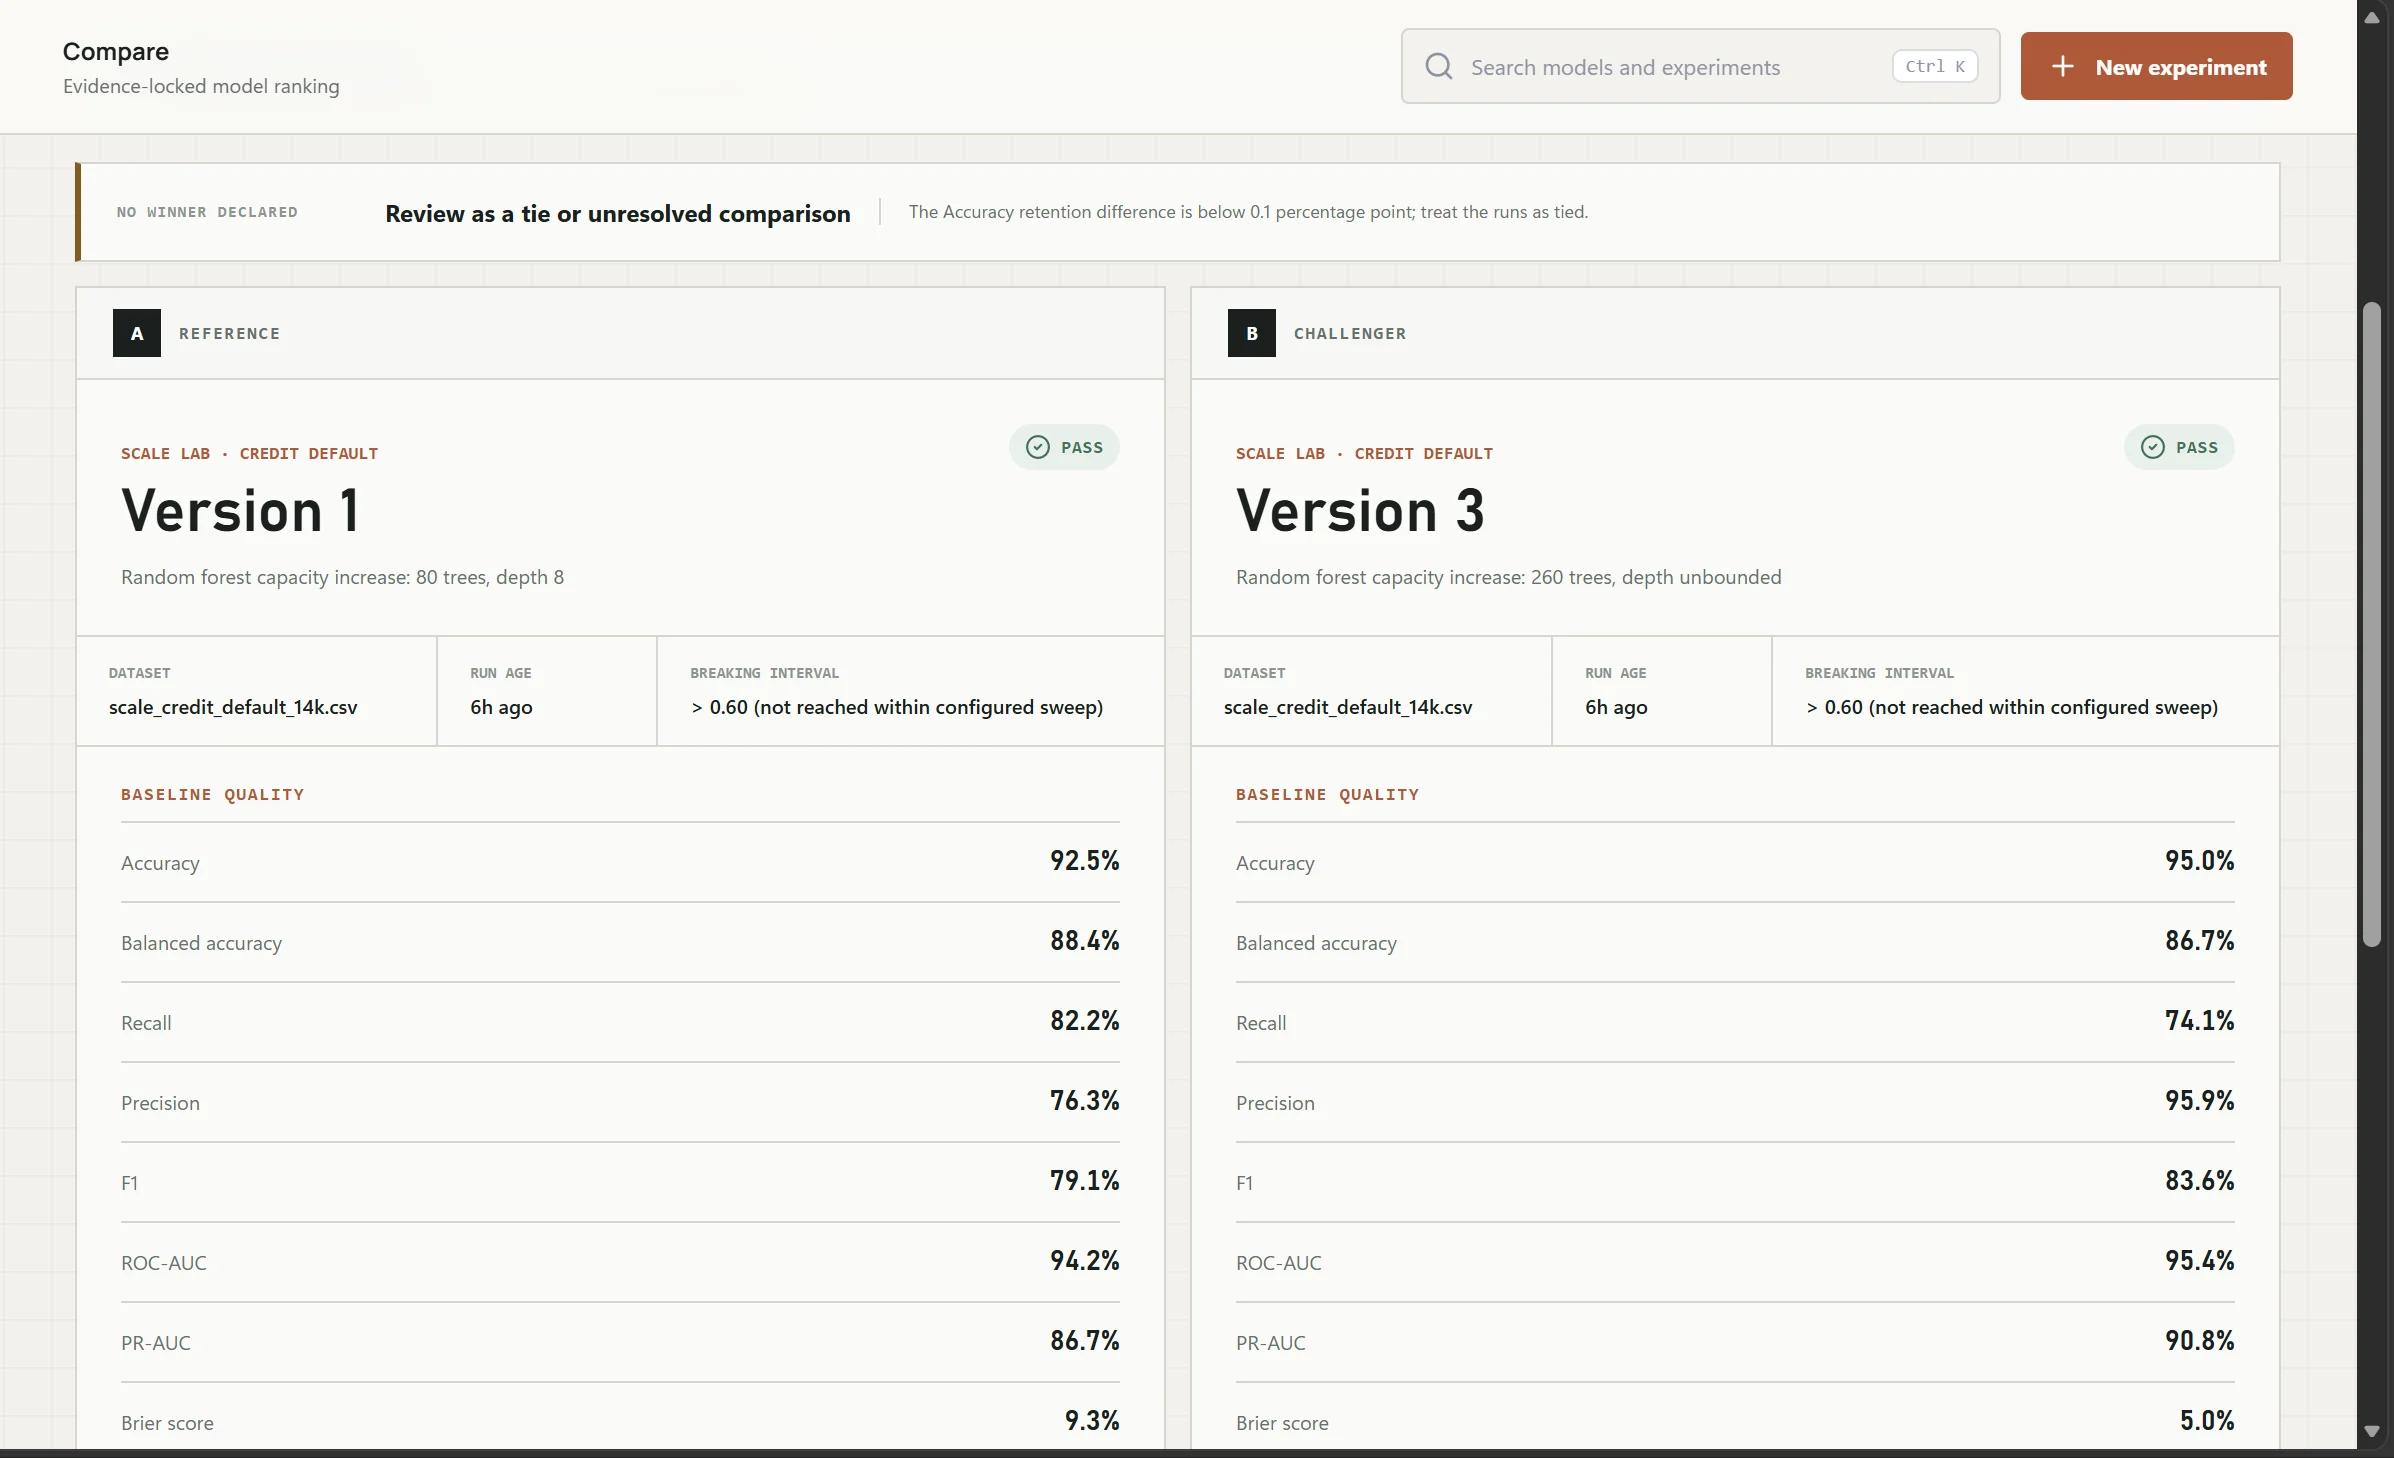
Compares reference and challenger versions using evidence relevant to promotion decisions.
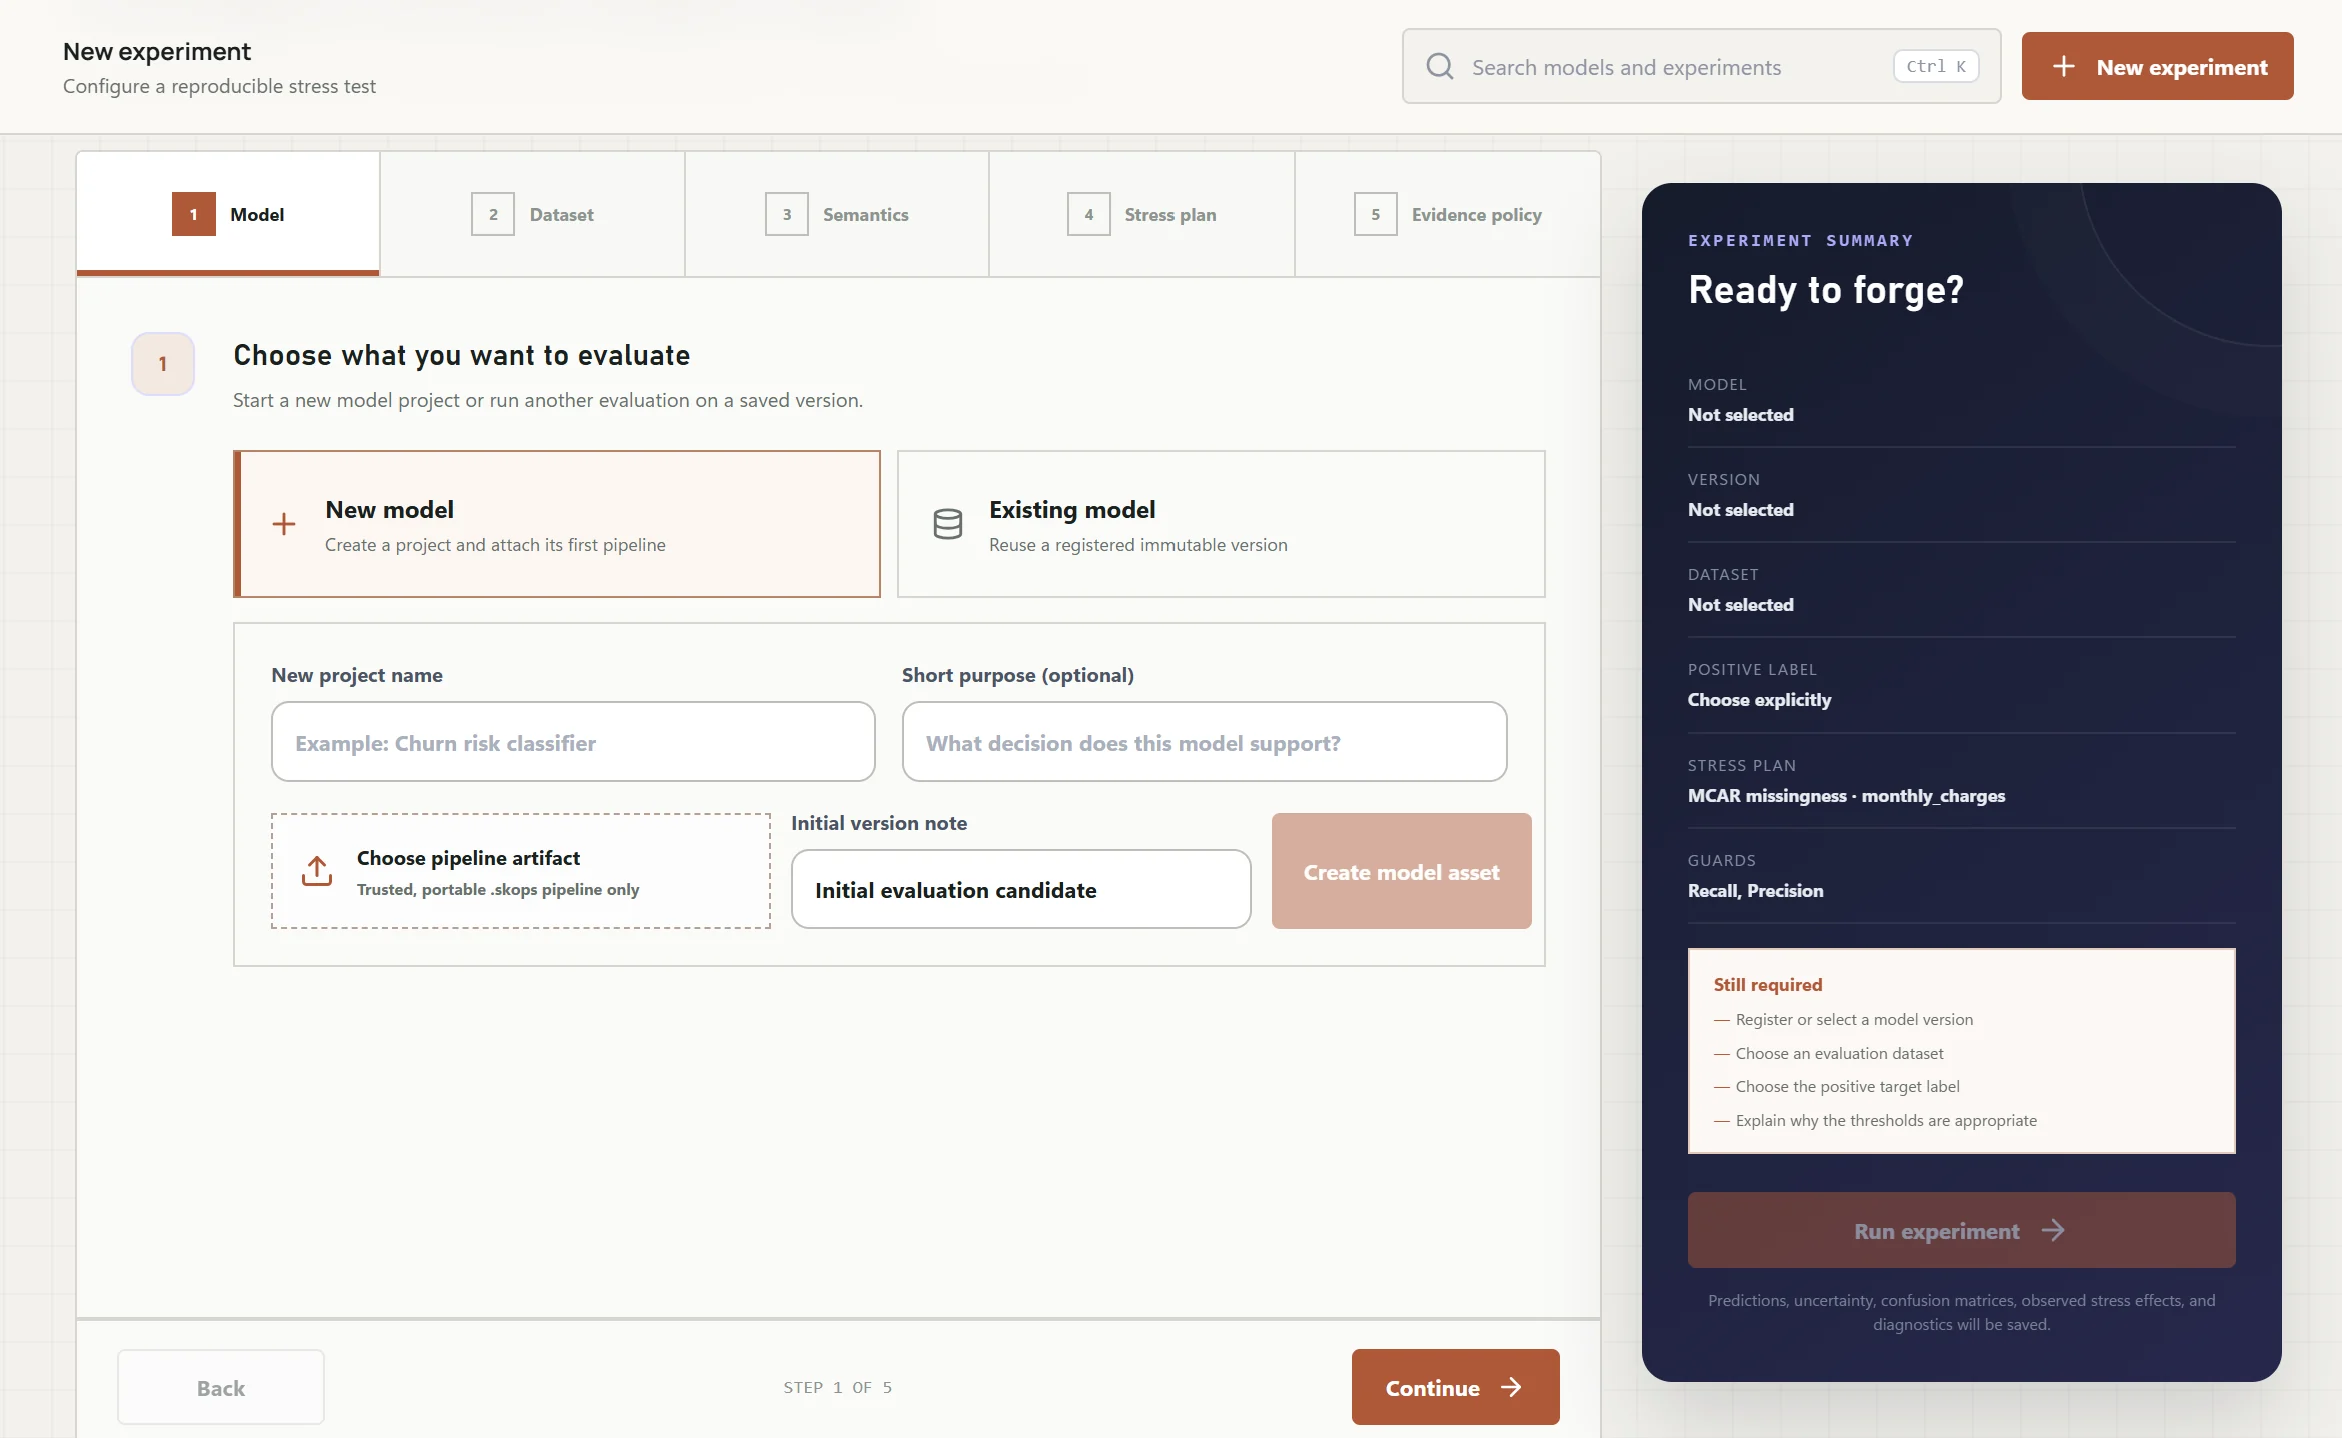
Turns a robustness evaluation into a guided, reproducible configuration workflow.
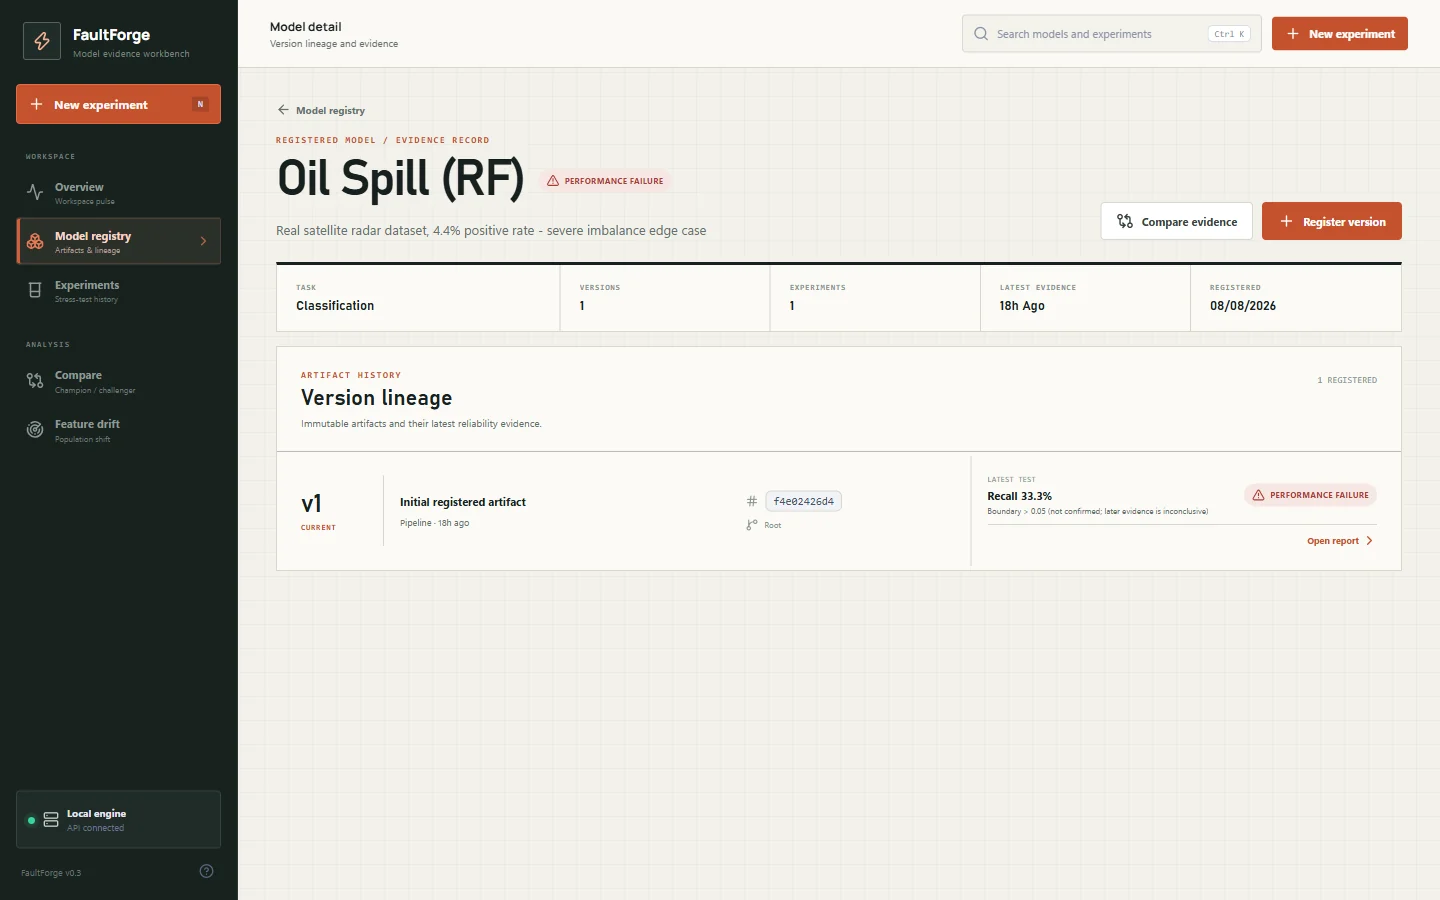
Documents a single model version's lineage, configuration, and evaluation history.
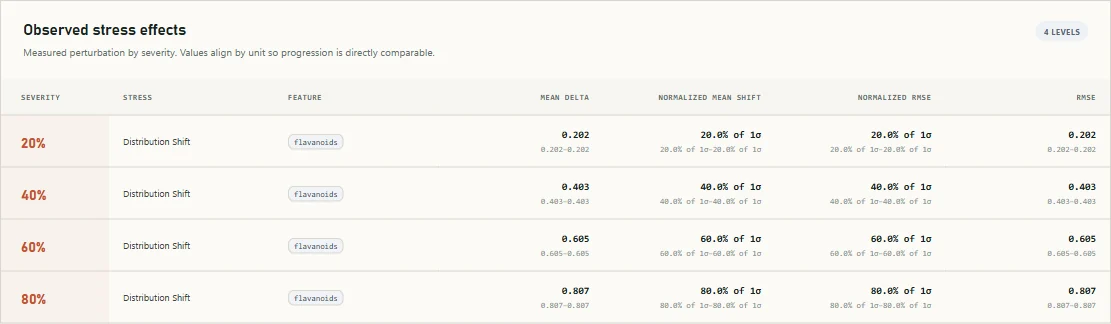
Maps pass, fail, and flaky outcomes across every stress type and severity level tested.
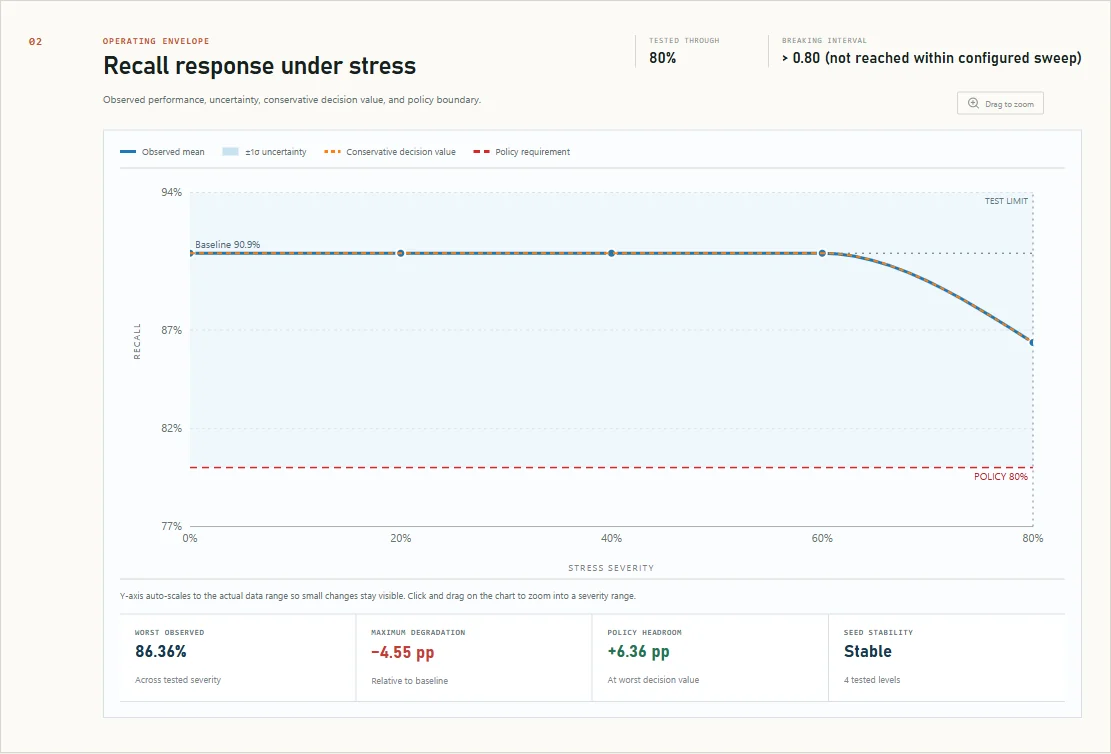
Plots metric trends across severity levels to visualize where performance actually breaks down.