Situation
Free per-stock Casablanca Stock Exchange history is fragmented, and existing sources rarely connect price data to risk context or explain uncertainty rather than predicting price.
Financial Analytics
A Casablanca Stock Exchange risk-intelligence platform combining a 124,562-row historical panel, stock and portfolio risk analysis, volatility and regime models, simulation, and structured news context.
View source repository↗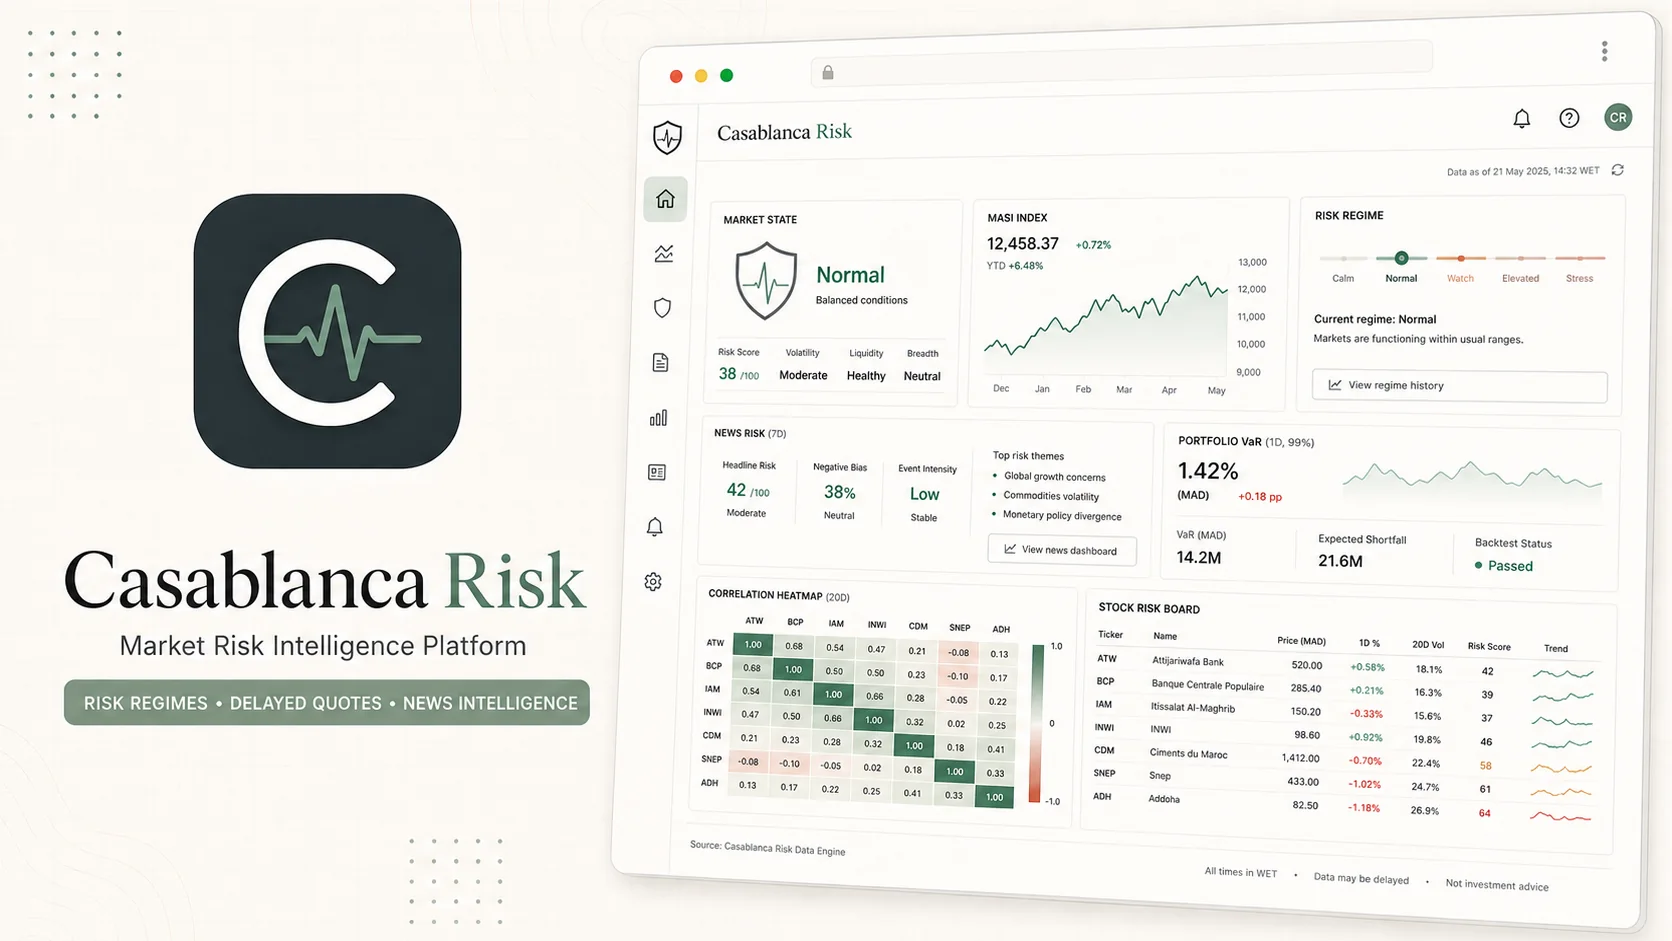
Why it matters
My role
Free per-stock Casablanca Stock Exchange history is fragmented, and existing sources rarely connect price data to risk context or explain uncertainty rather than predicting price.
Build a risk-intelligence platform that assembles a reliable local-market panel, quantifies stock and portfolio risk, and translates it into decision support, without presenting analytics as price prediction or investment advice.
The platform surfaces that domestic diversification can be limited by bank and telecom concentration, while the MASI's lower correlation with global indices may make Moroccan equities more relevant for international diversification. It is delivered through searchable snapshots, risk profiles, rankings, and a virtual trading simulator that keep uncertainty and data limitations visible rather than hidden.
Technical implementation
Each layer connects an implementation choice to the decision or workflow it supports.
07 layers| Layer | Implementation | Operational purpose |
|---|---|---|
| Market collection | Requests, Beautiful Soup and source-specific adapters for delayed quotes and issuer data | Build a consistent local-market panel from fragmented public sources |
| News collection | French and Arabic financial-news scraping with normalized headlines, provenance and cross-source deduplication | Connect market analysis to traceable company, sector and macro context |
| Data reliability | robots.txt checks, raw-response caching, schema validation, lock files, scheduling and atomic writes | Preserve the last valid dataset and expose stale or failed refreshes honestly |
| Risk measurement | Volatility, beta, drawdown, historical VaR, Expected Shortfall, correlation and liquidity indicators | Compare stock and portfolio exposure with interpretable downside measures |
| Risk modelling | GARCH volatility forecasts, HMM regimes and Kupiec VaR backtesting | Estimate changing risk conditions and verify whether loss thresholds remain credible |
| Portfolio analysis | Minimum variance, Hierarchical Risk Parity, Ledoit-Wolf covariance and walk-forward testing | Compare allocations using out-of-sample evidence, costs and investability gates |
| Simulation and events | 10,000-path Monte Carlo distributions and market-model event studies | Quantify ranges of outcomes and examine abnormal behaviour around news events |
Product walkthrough

Sets the visual direction for the platform before the functional screens that follow.
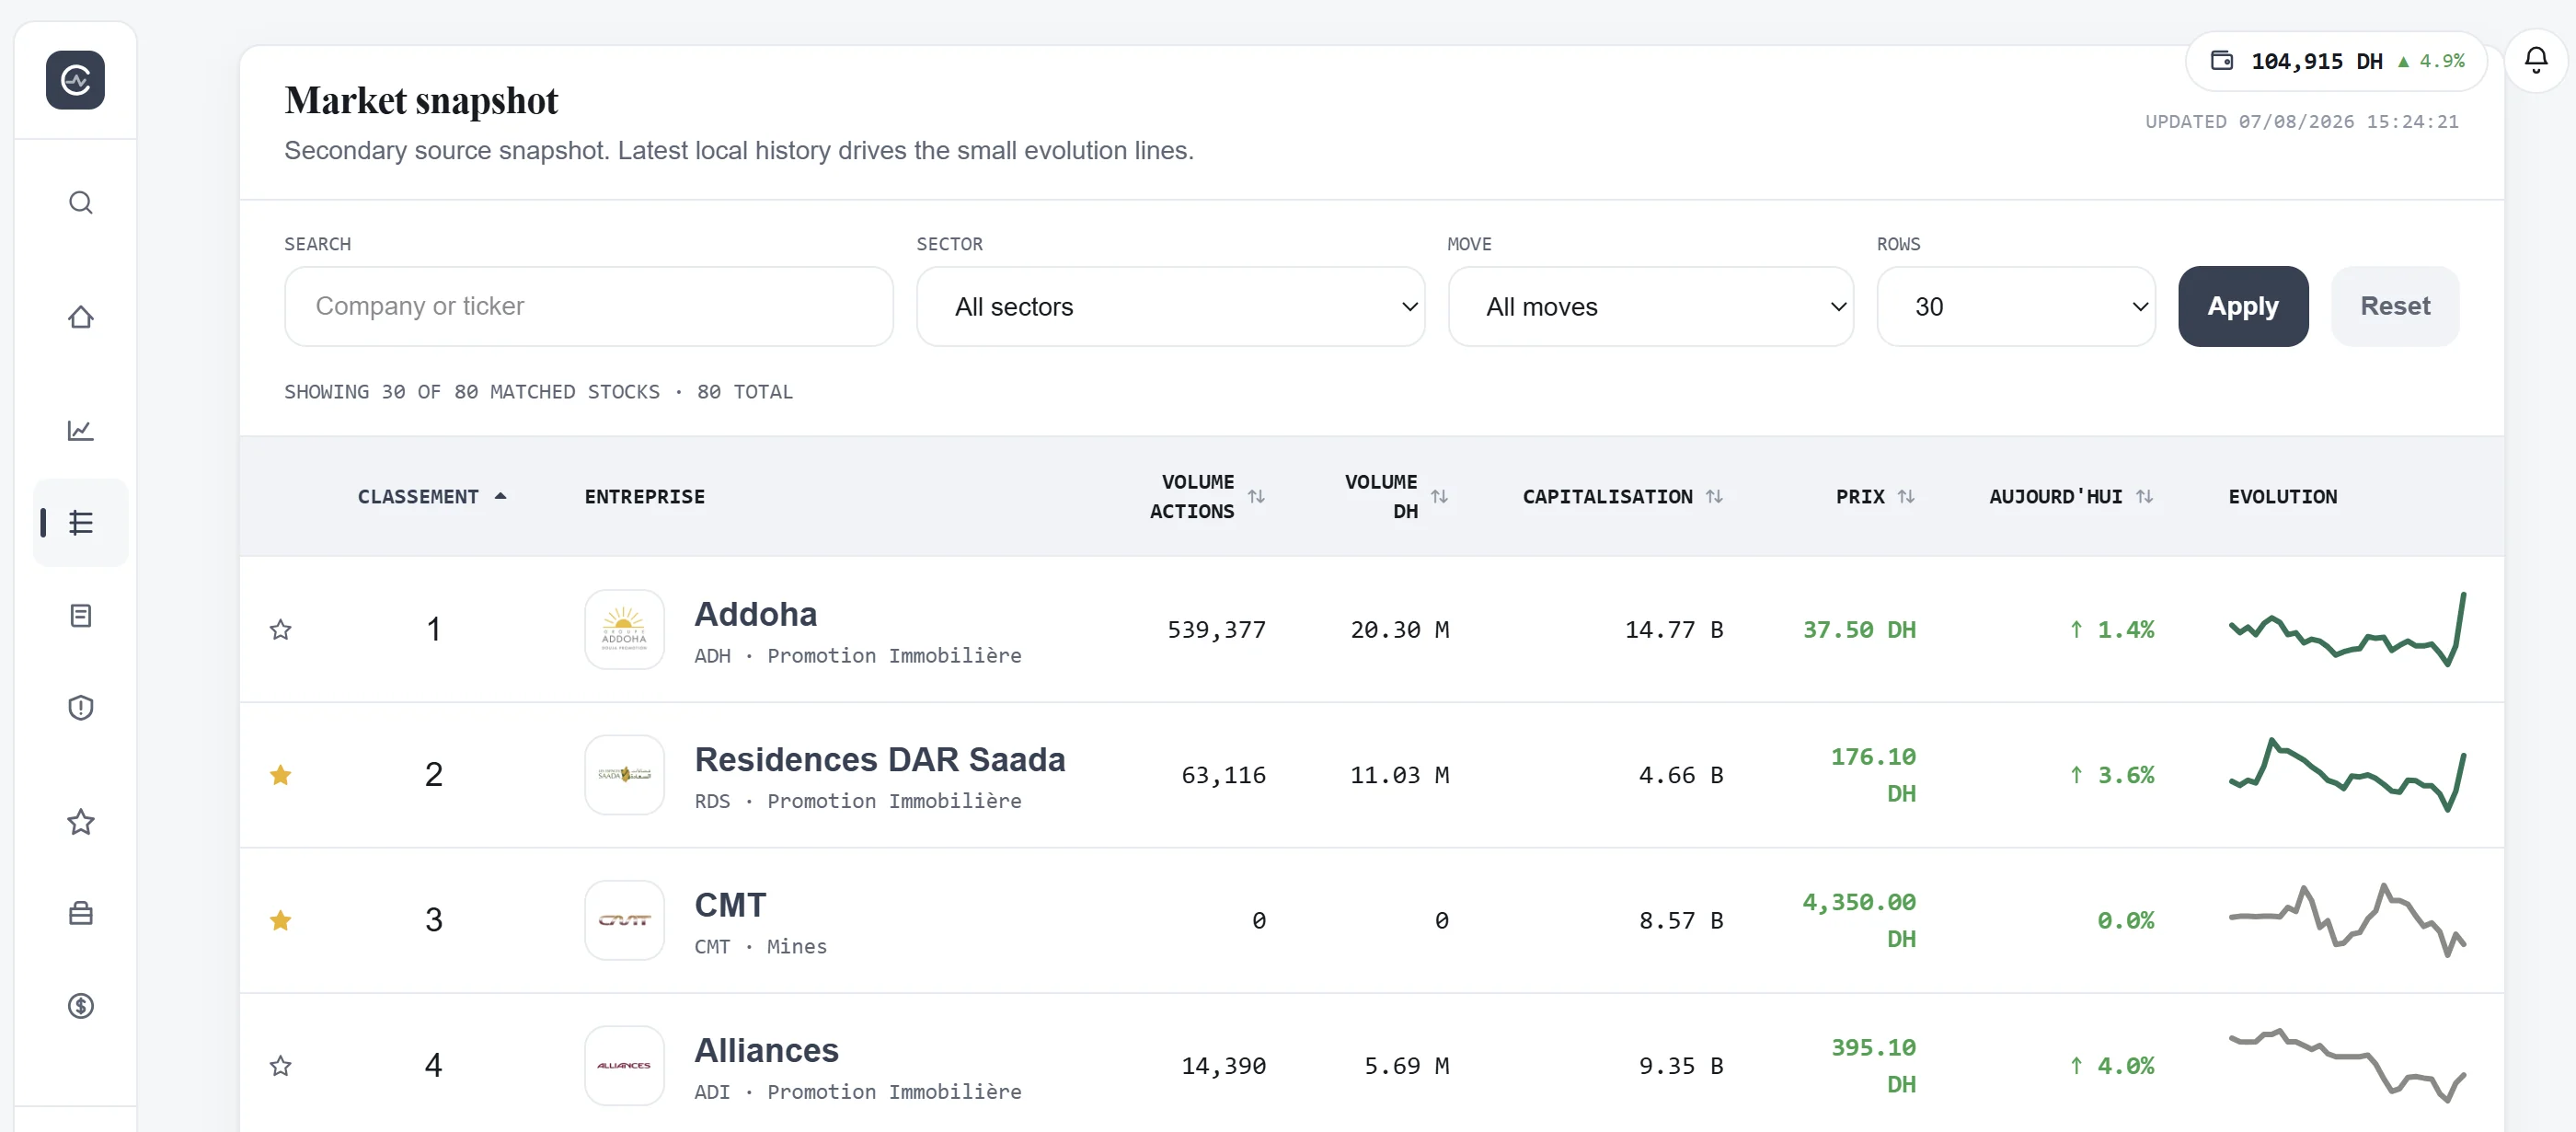
Makes the listed market searchable and comparable through price, volume, capitalization, and recent movement.
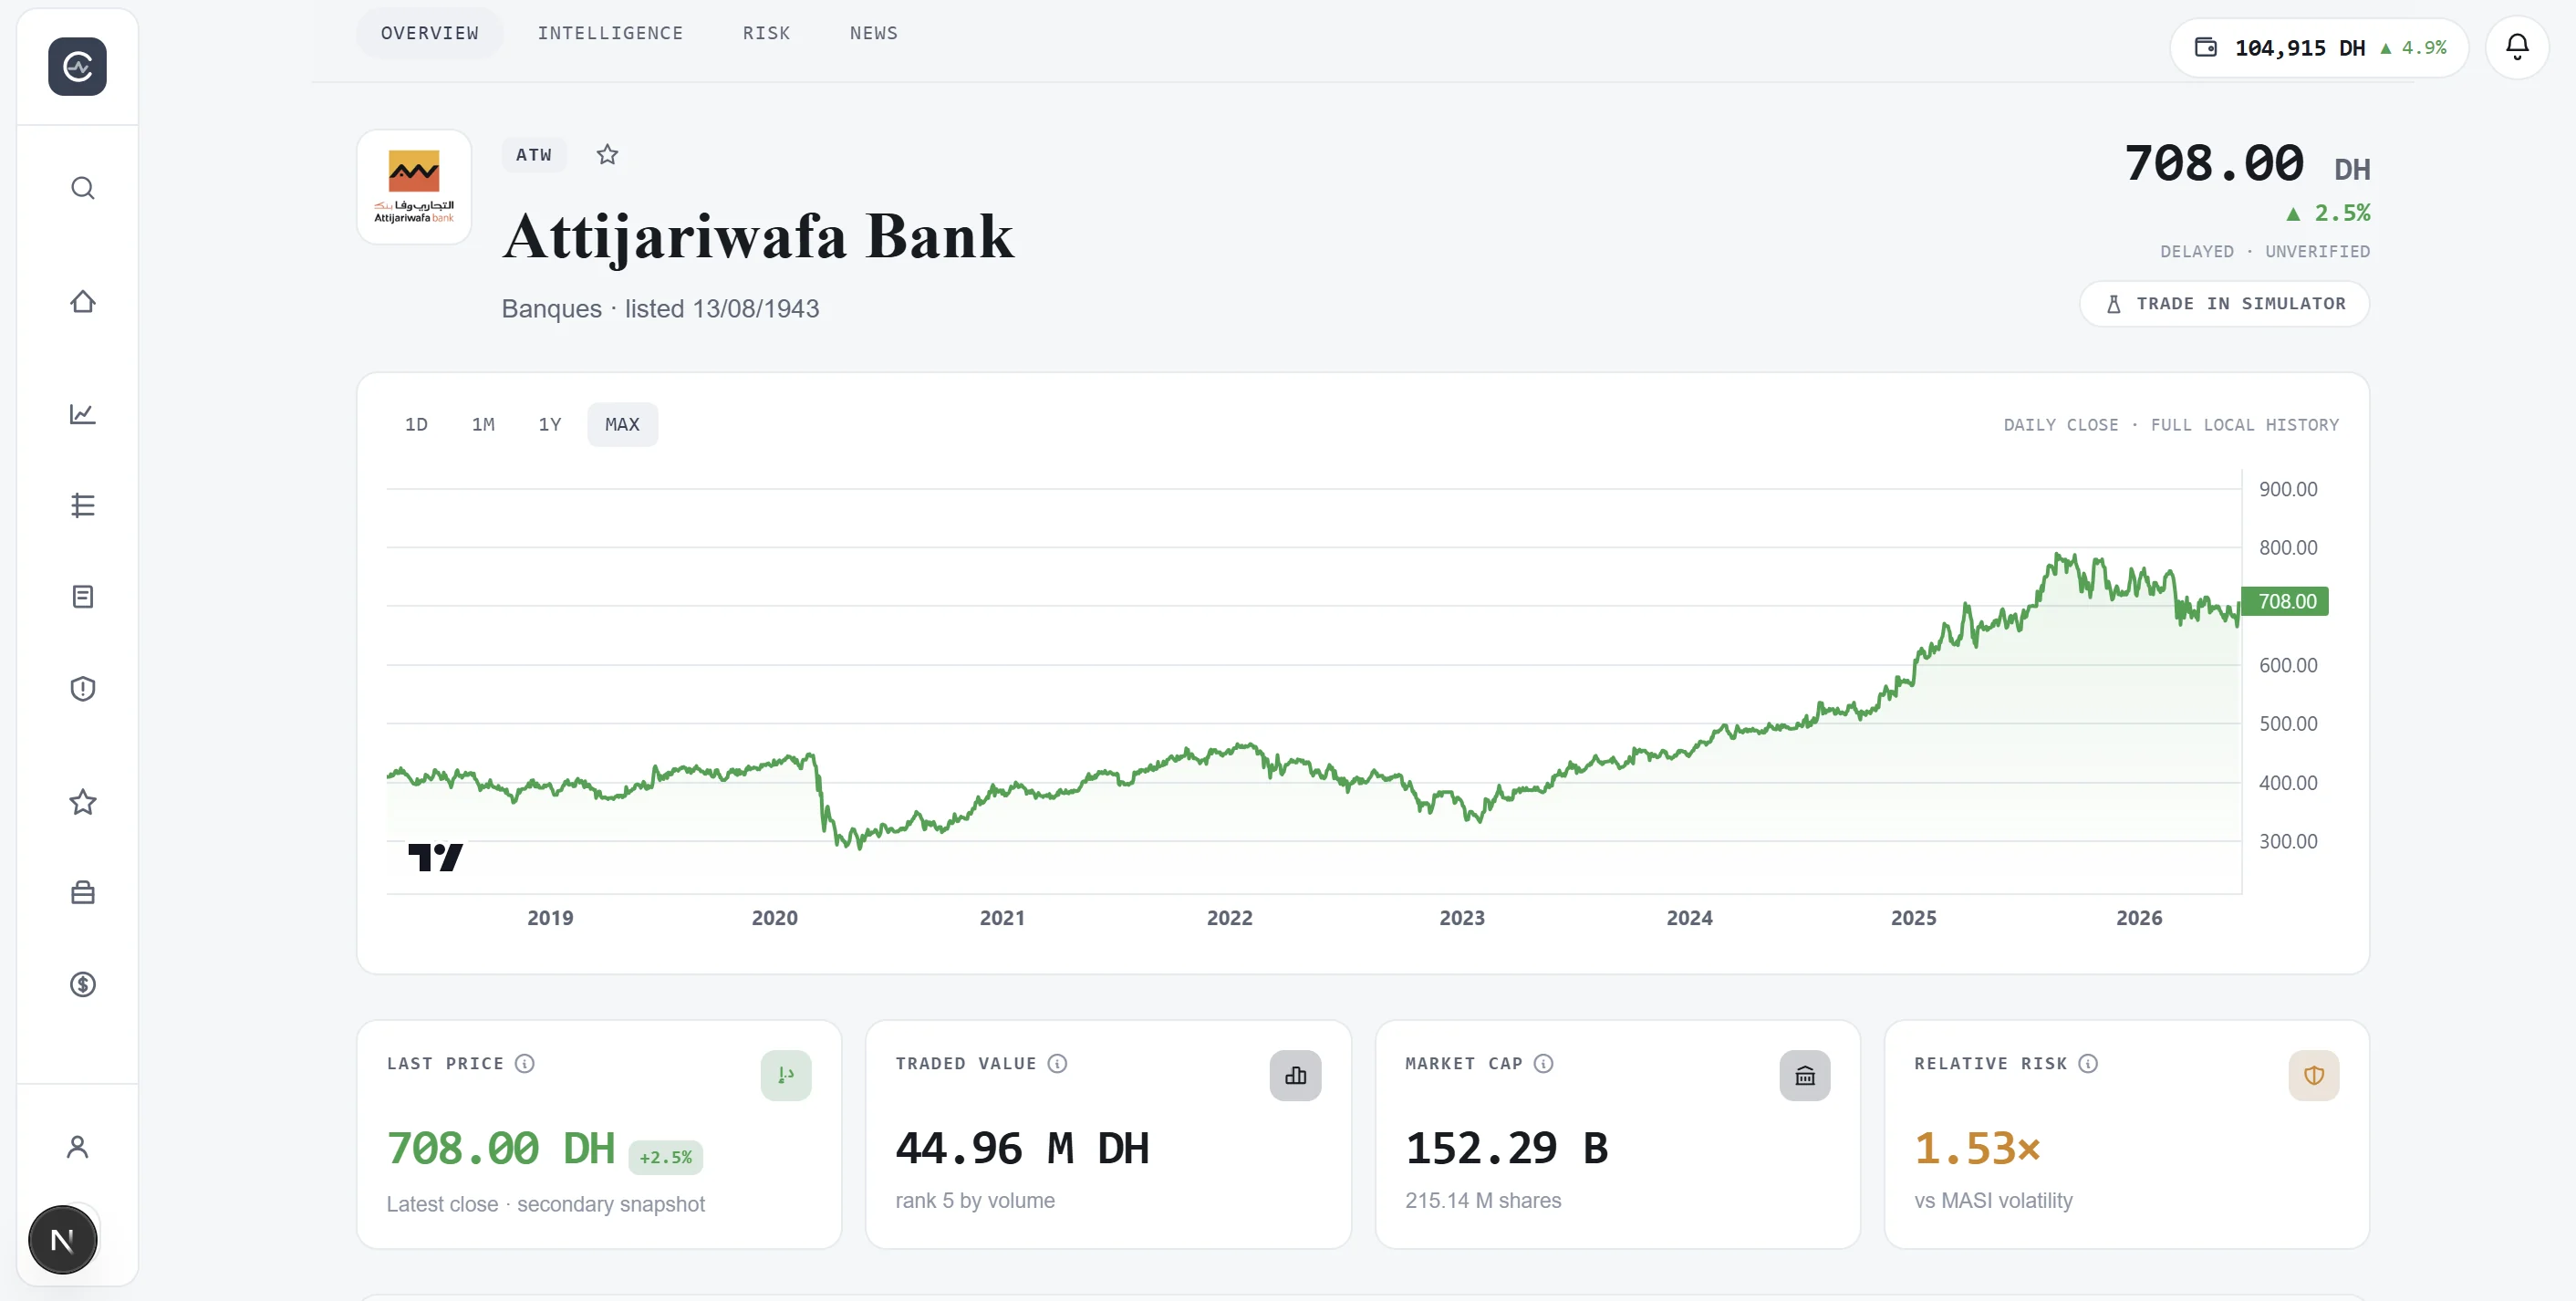
Combines historical price context with market value, traded value, and relative-risk indicators.
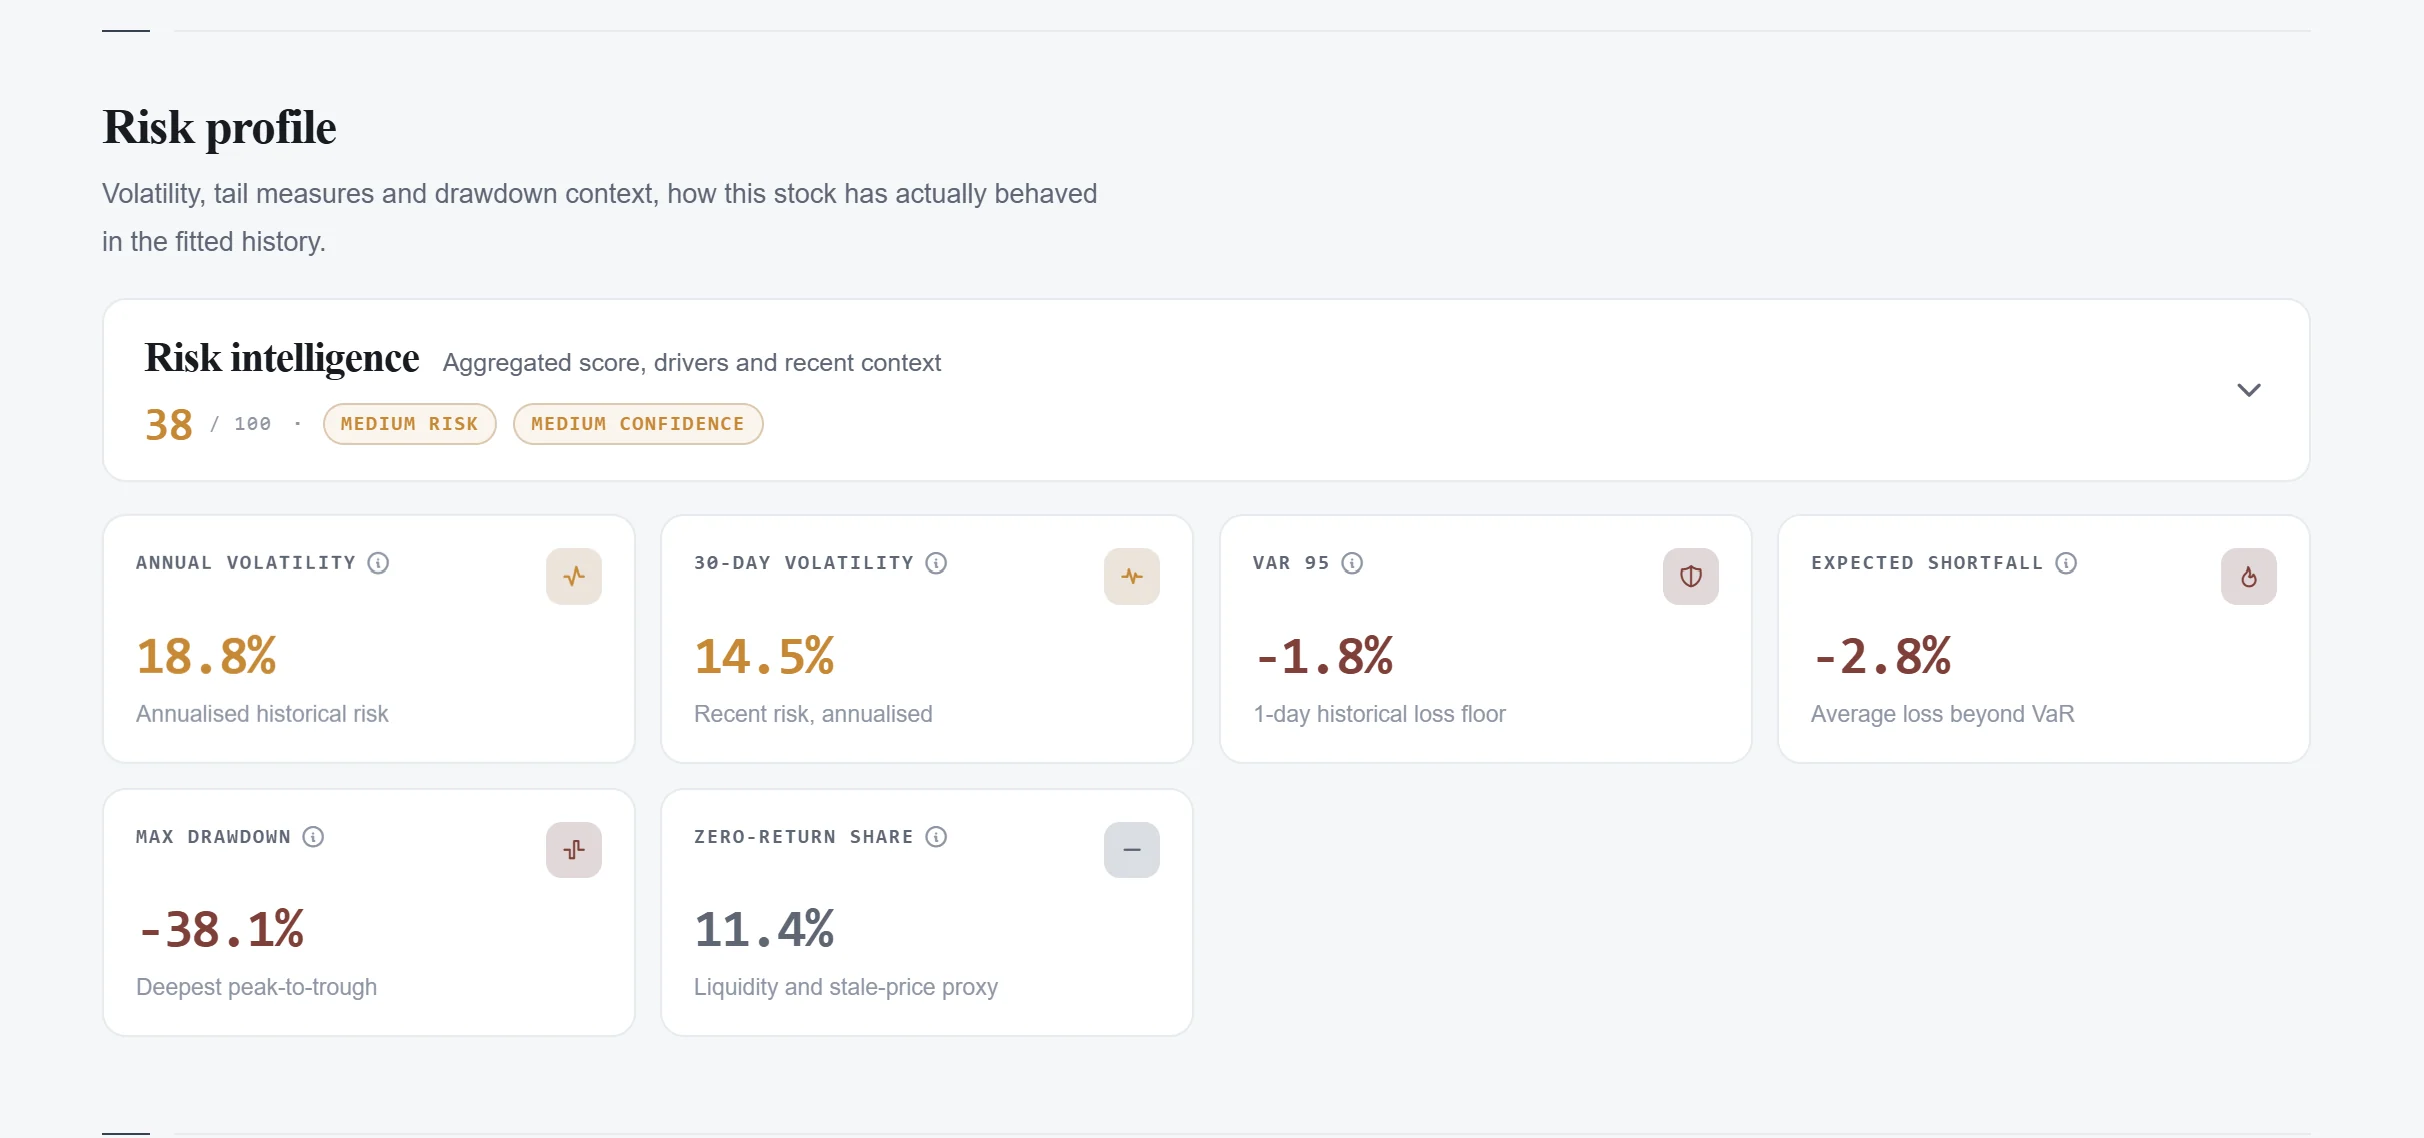
Translates volatility, VaR, expected shortfall, and drawdown into a readable risk profile.
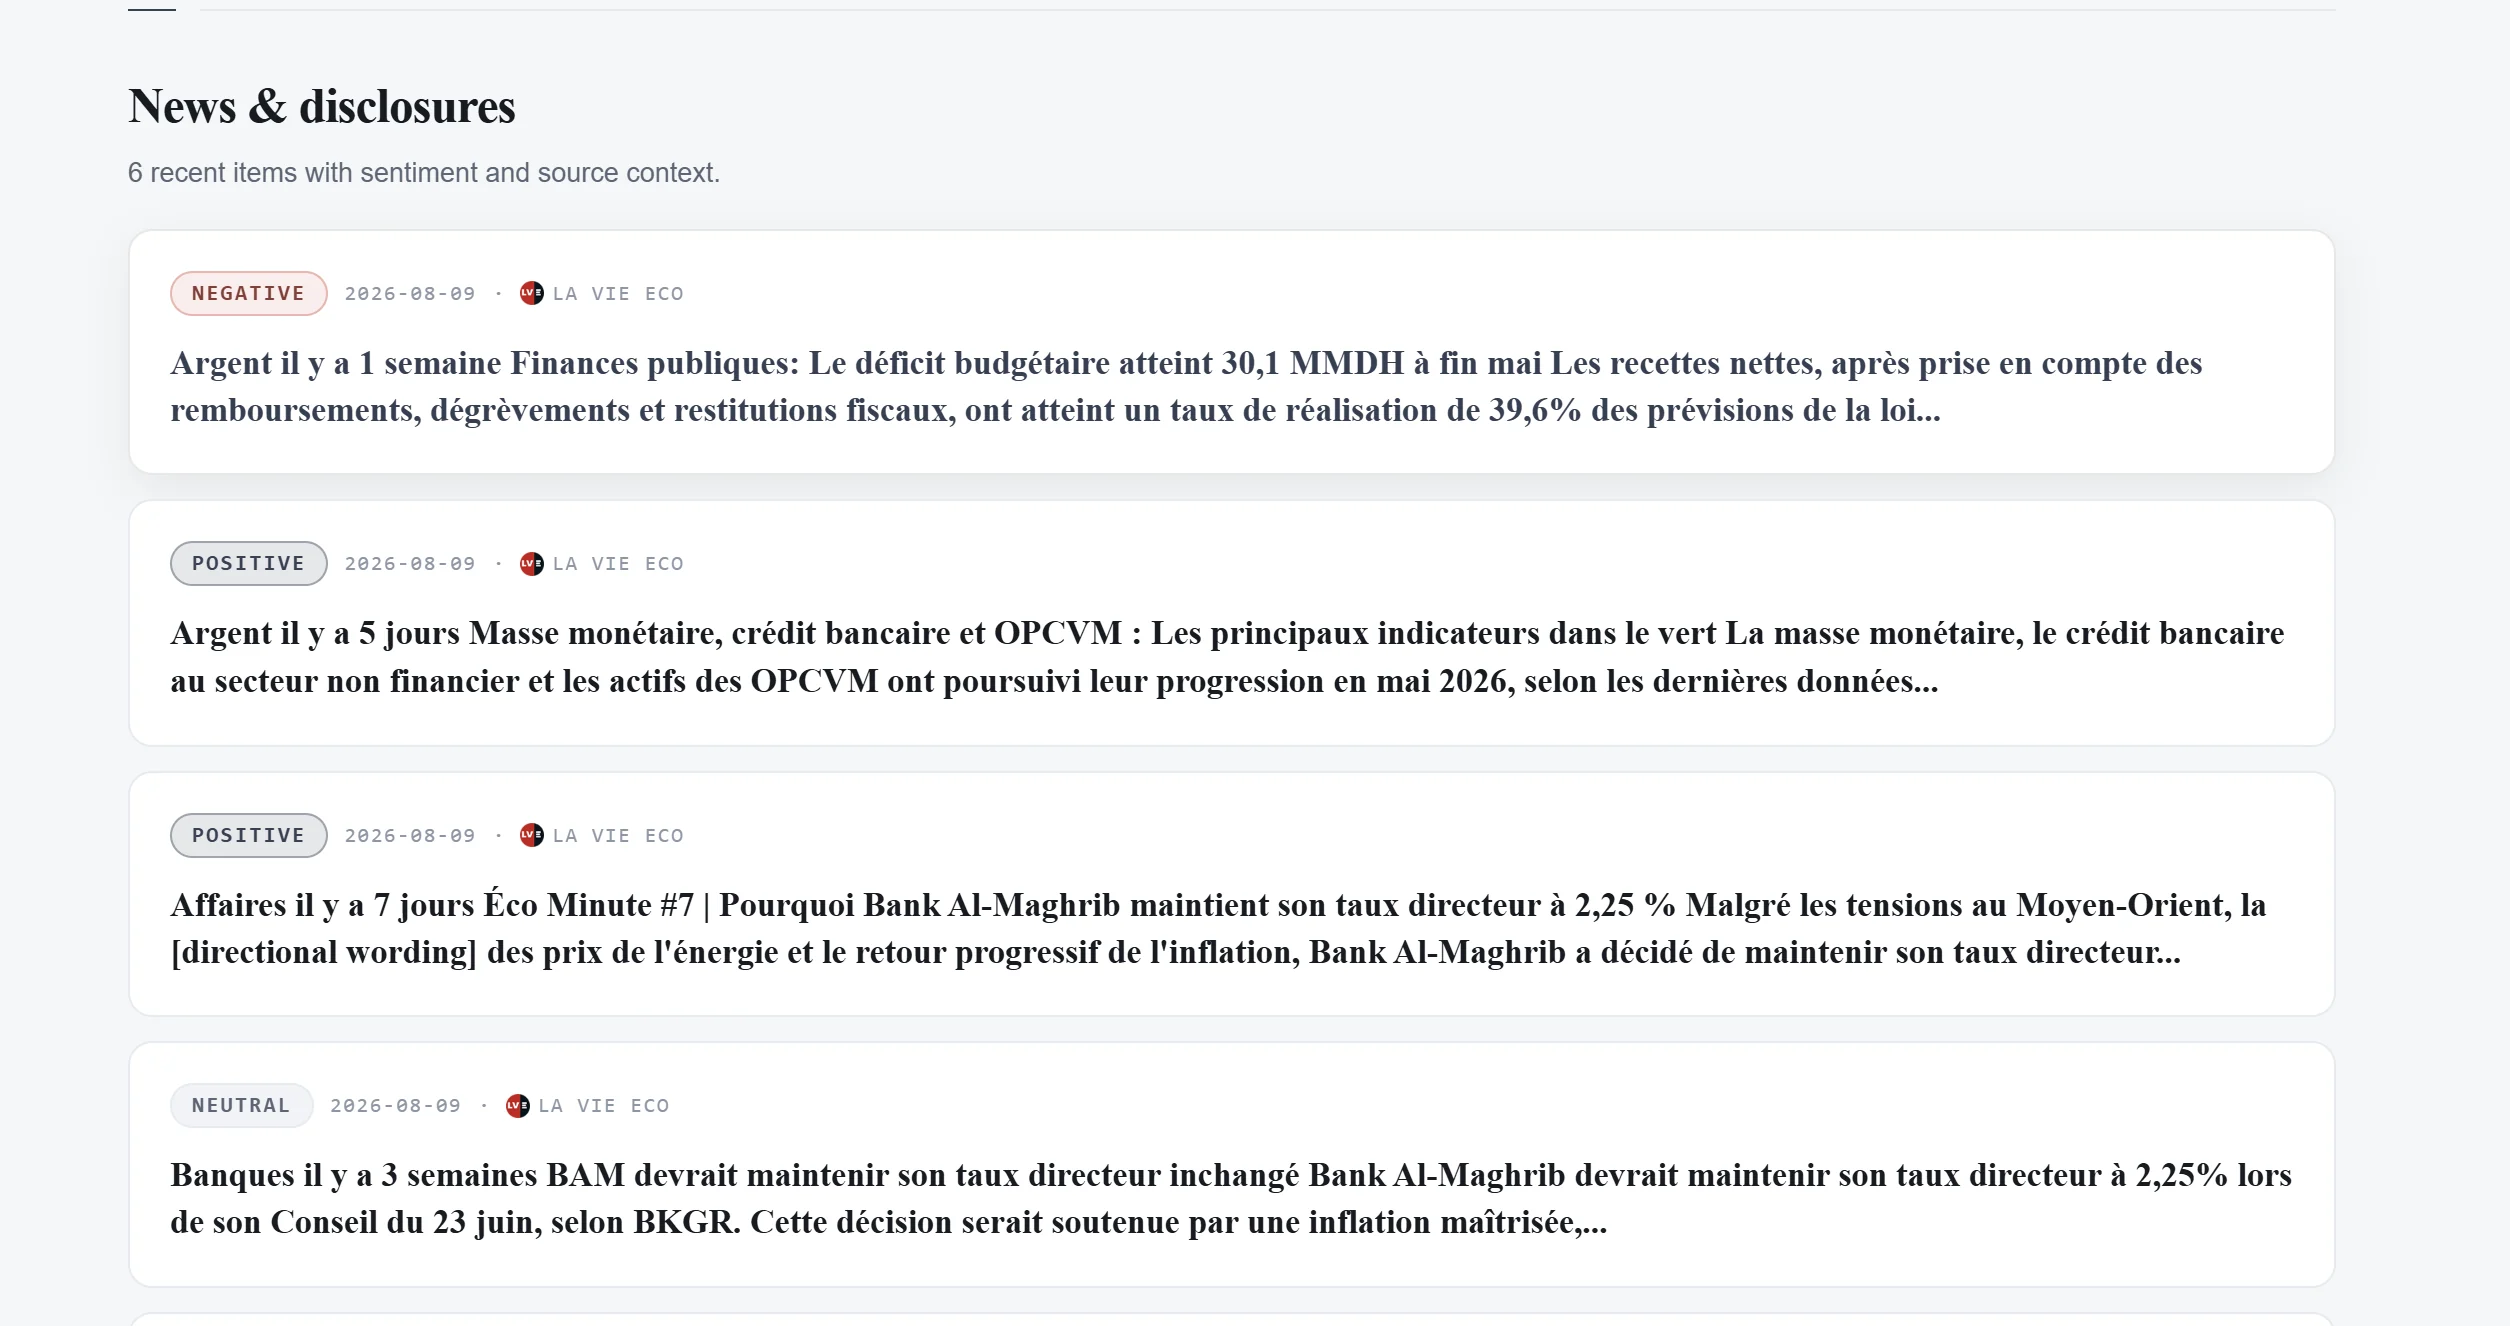
Connects company-level disclosures and sentiment context to the security being examined.
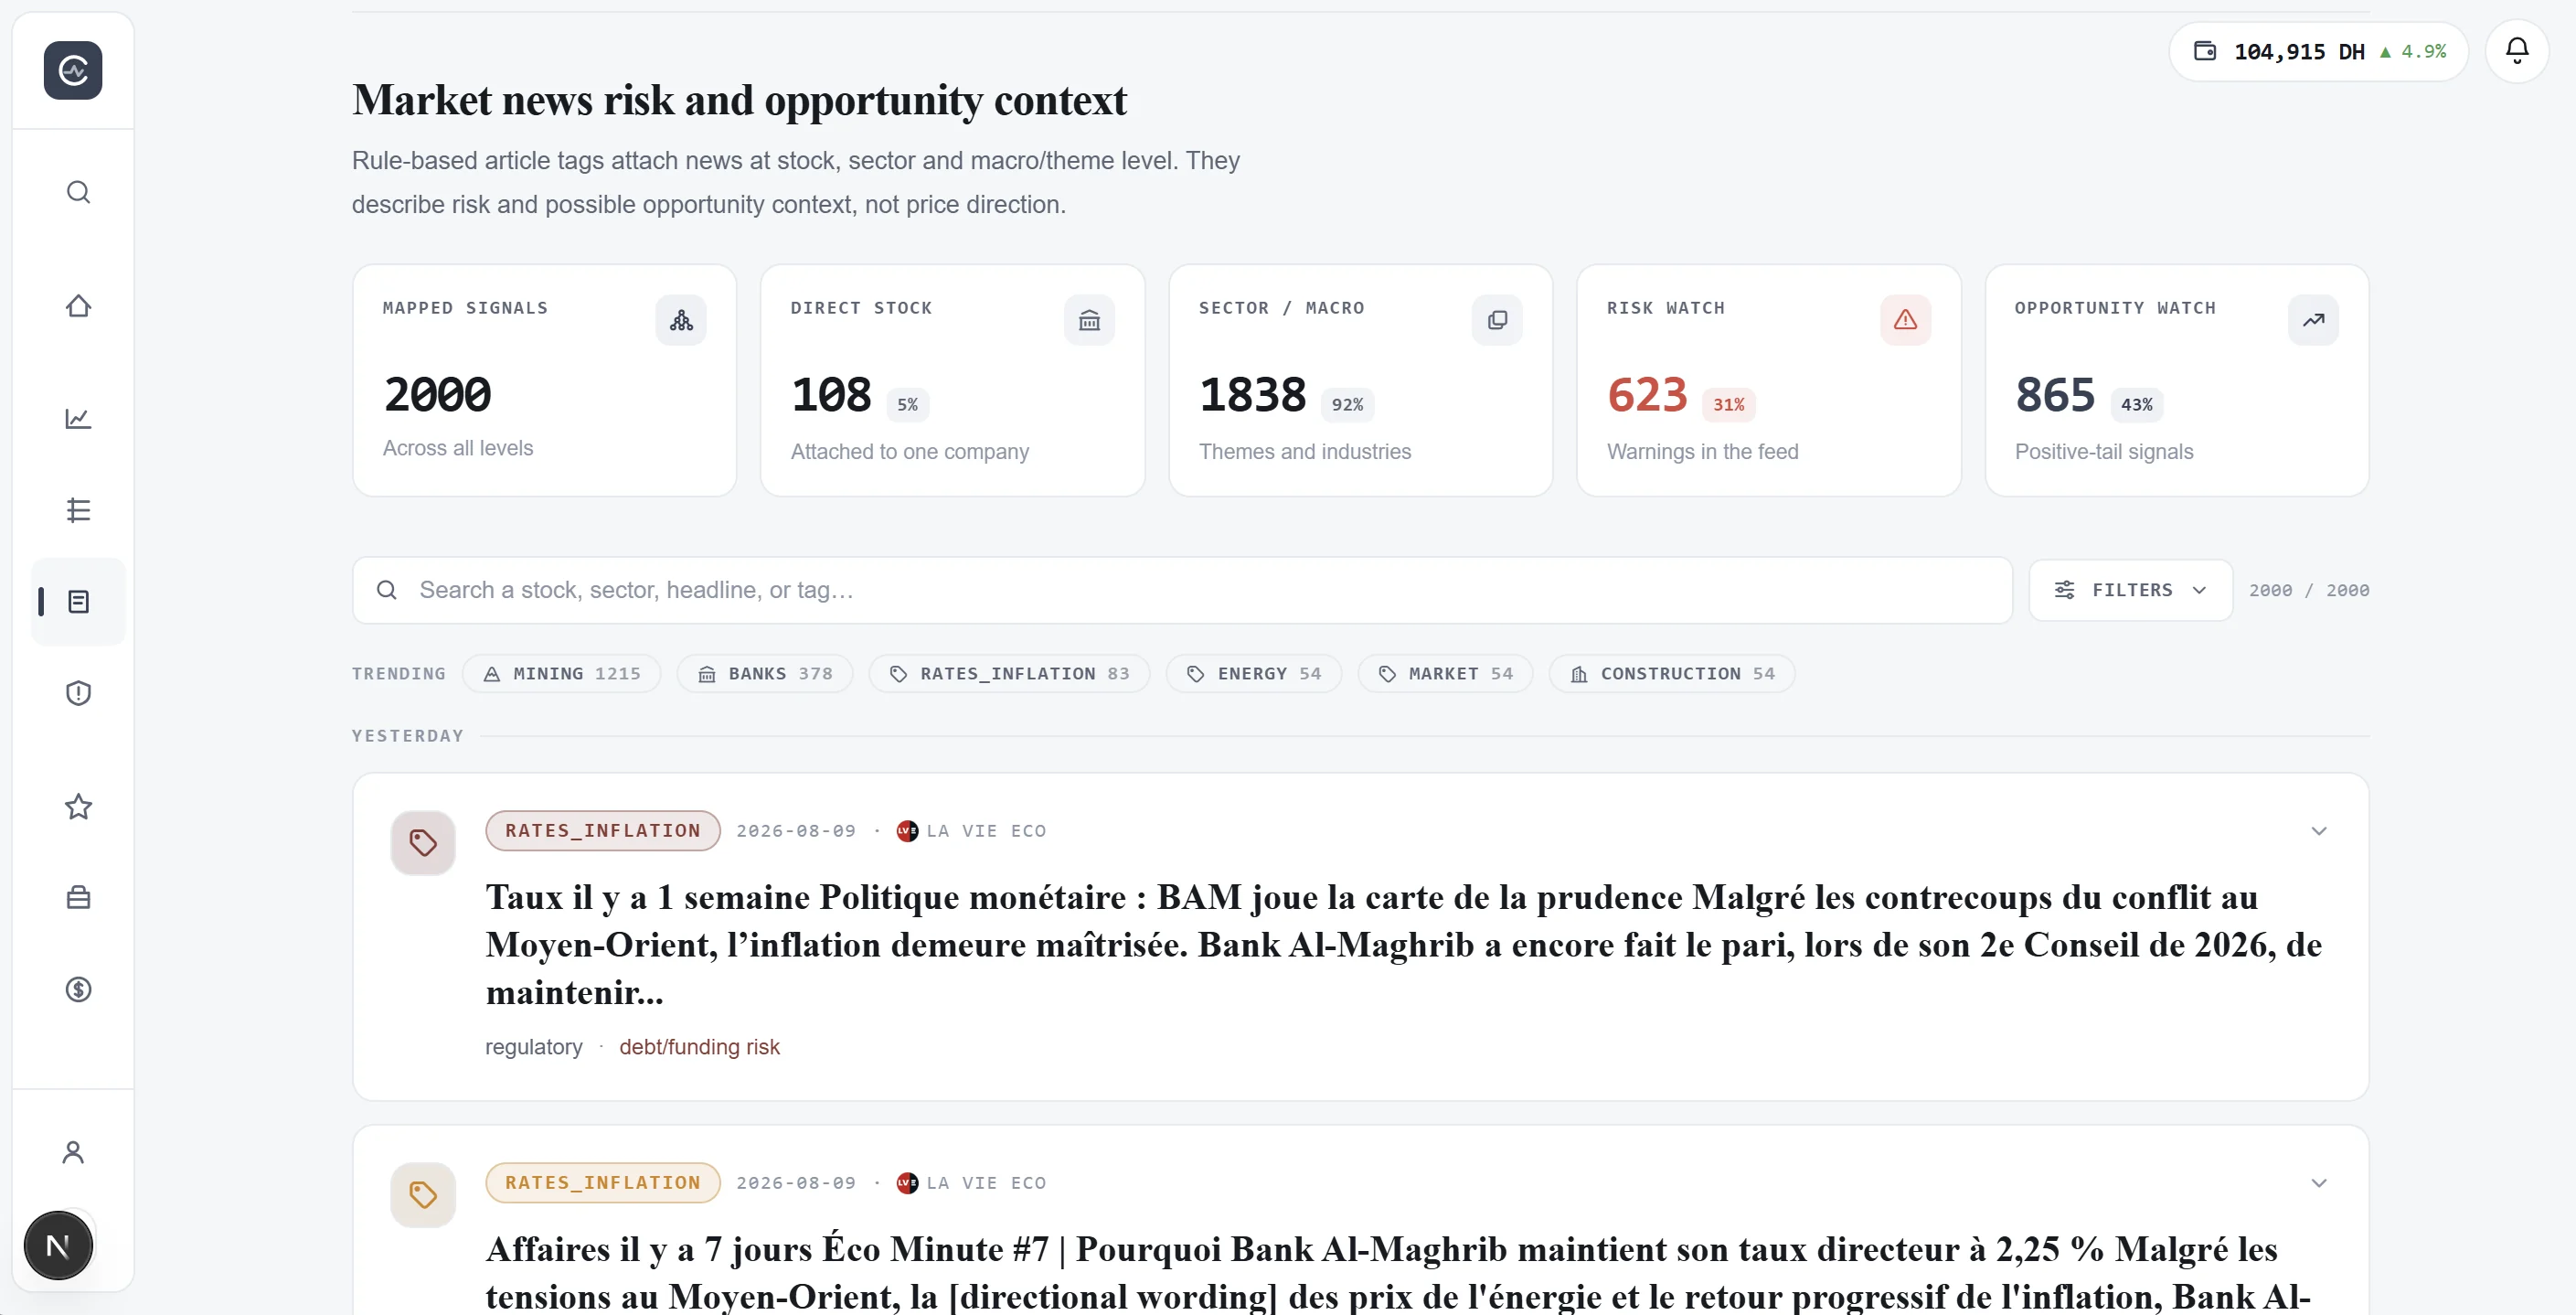
Maps news to stocks, sectors, and macro themes to distinguish risk signals from opportunity context.
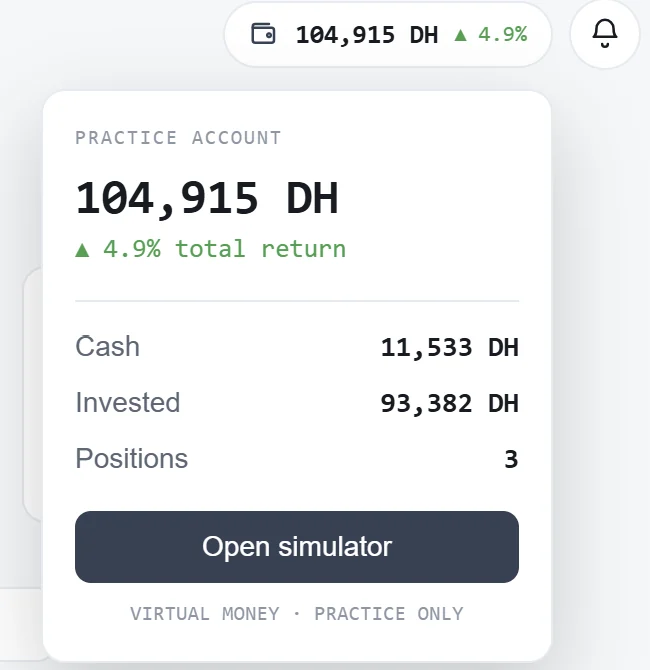
Keeps virtual cash, invested capital, positions, and return visible before entering the simulator.
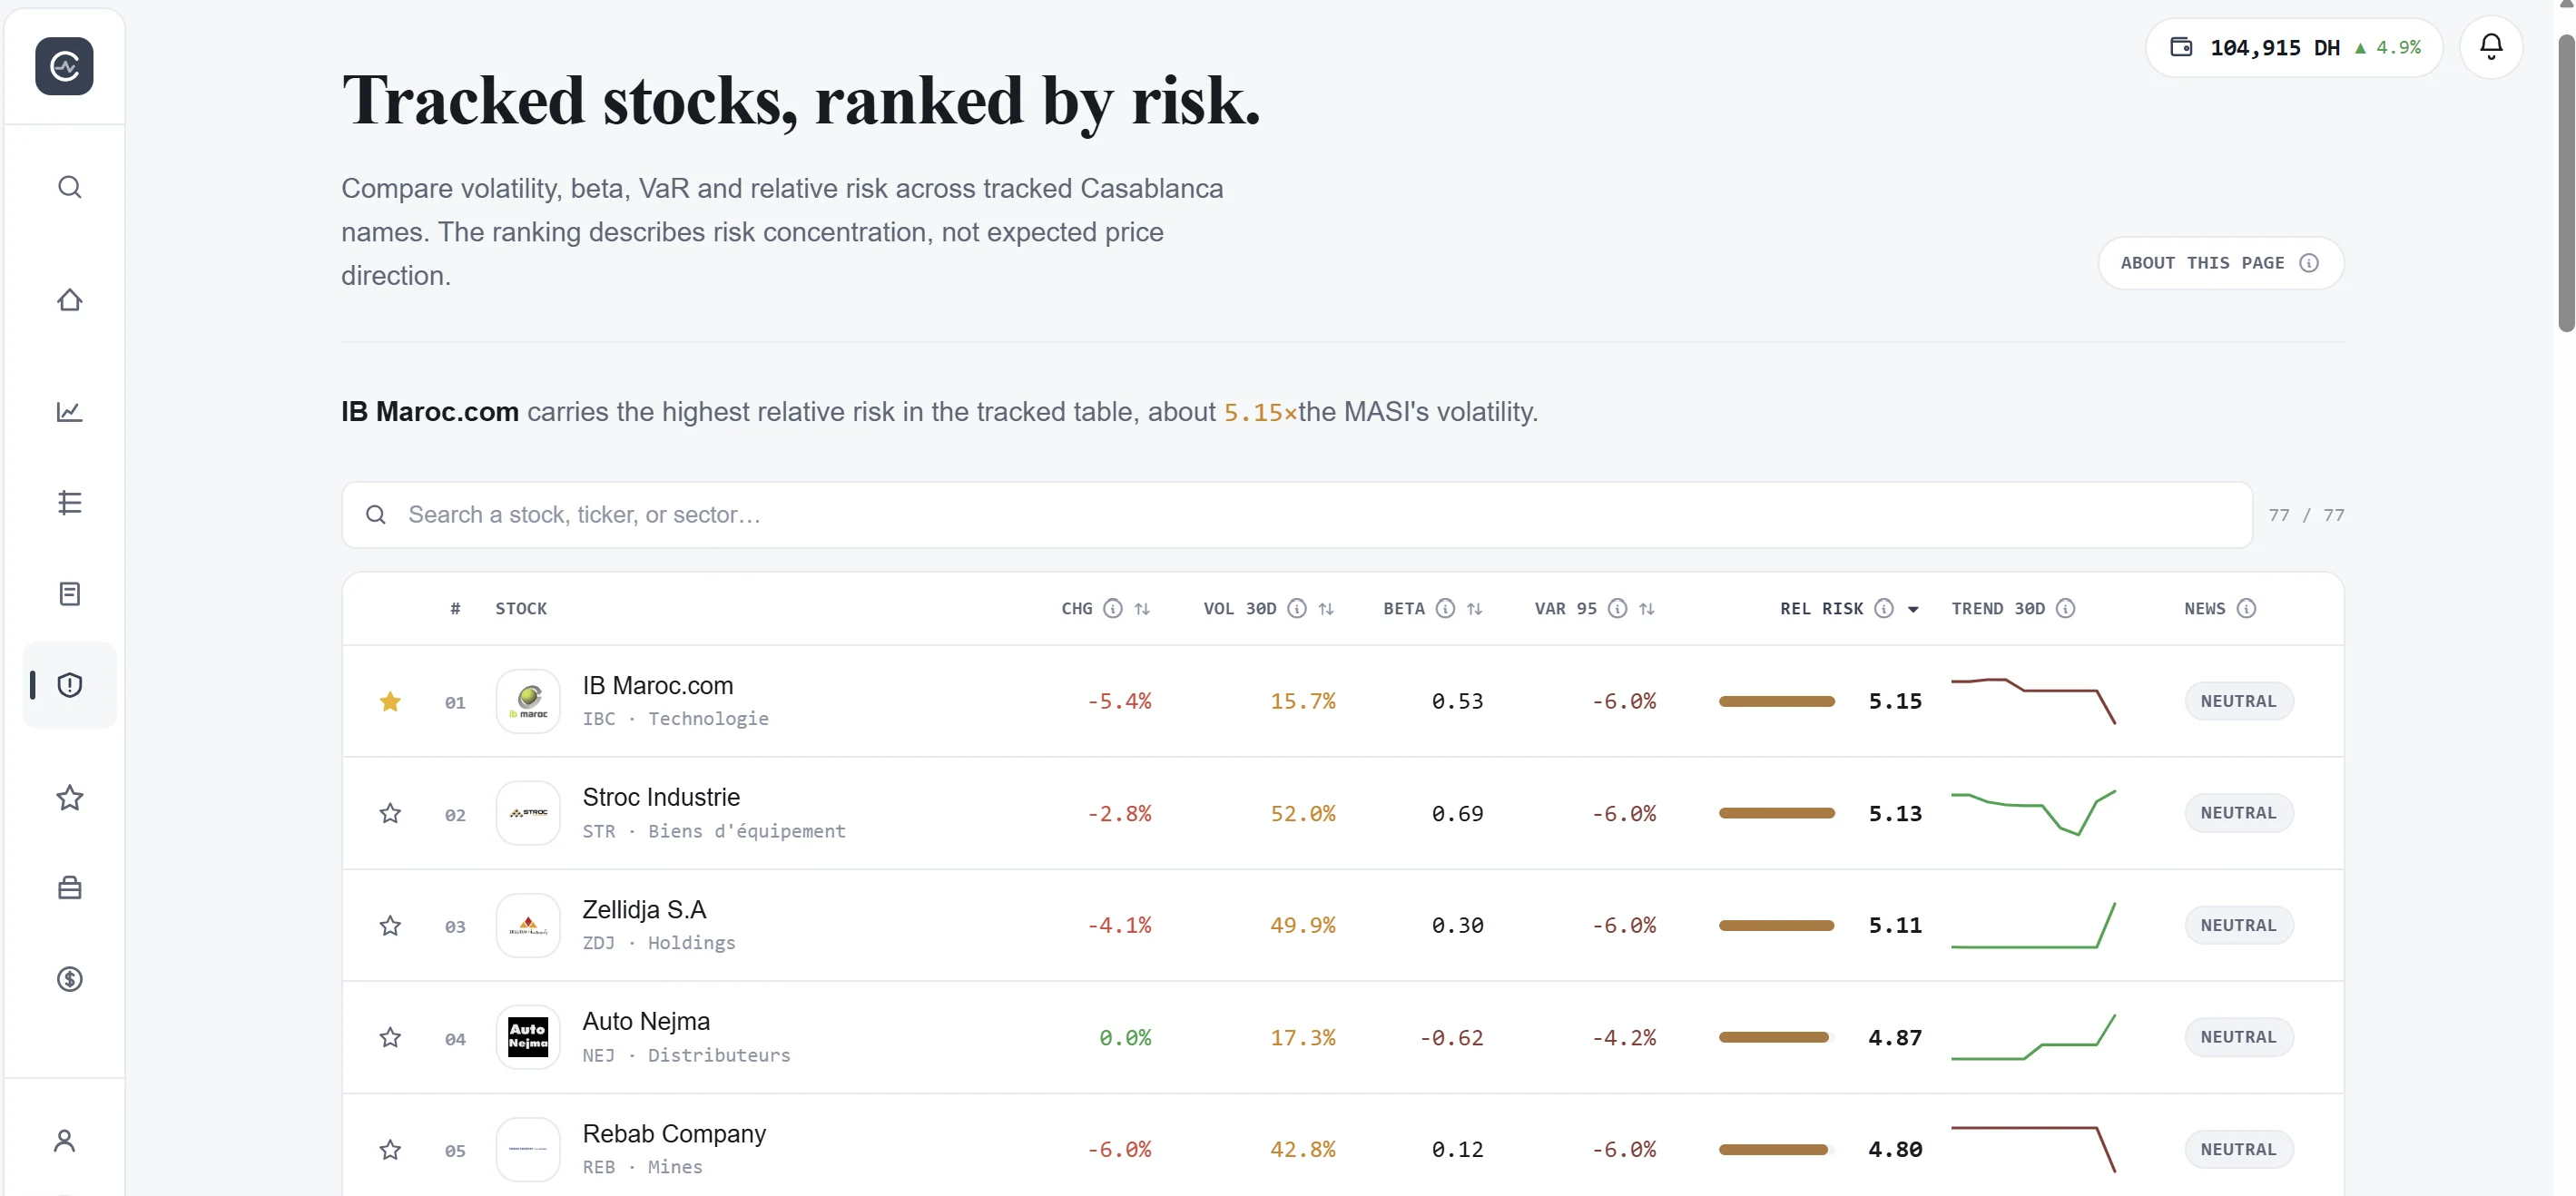
Ranks tracked securities by comparable risk measures instead of implying price direction.
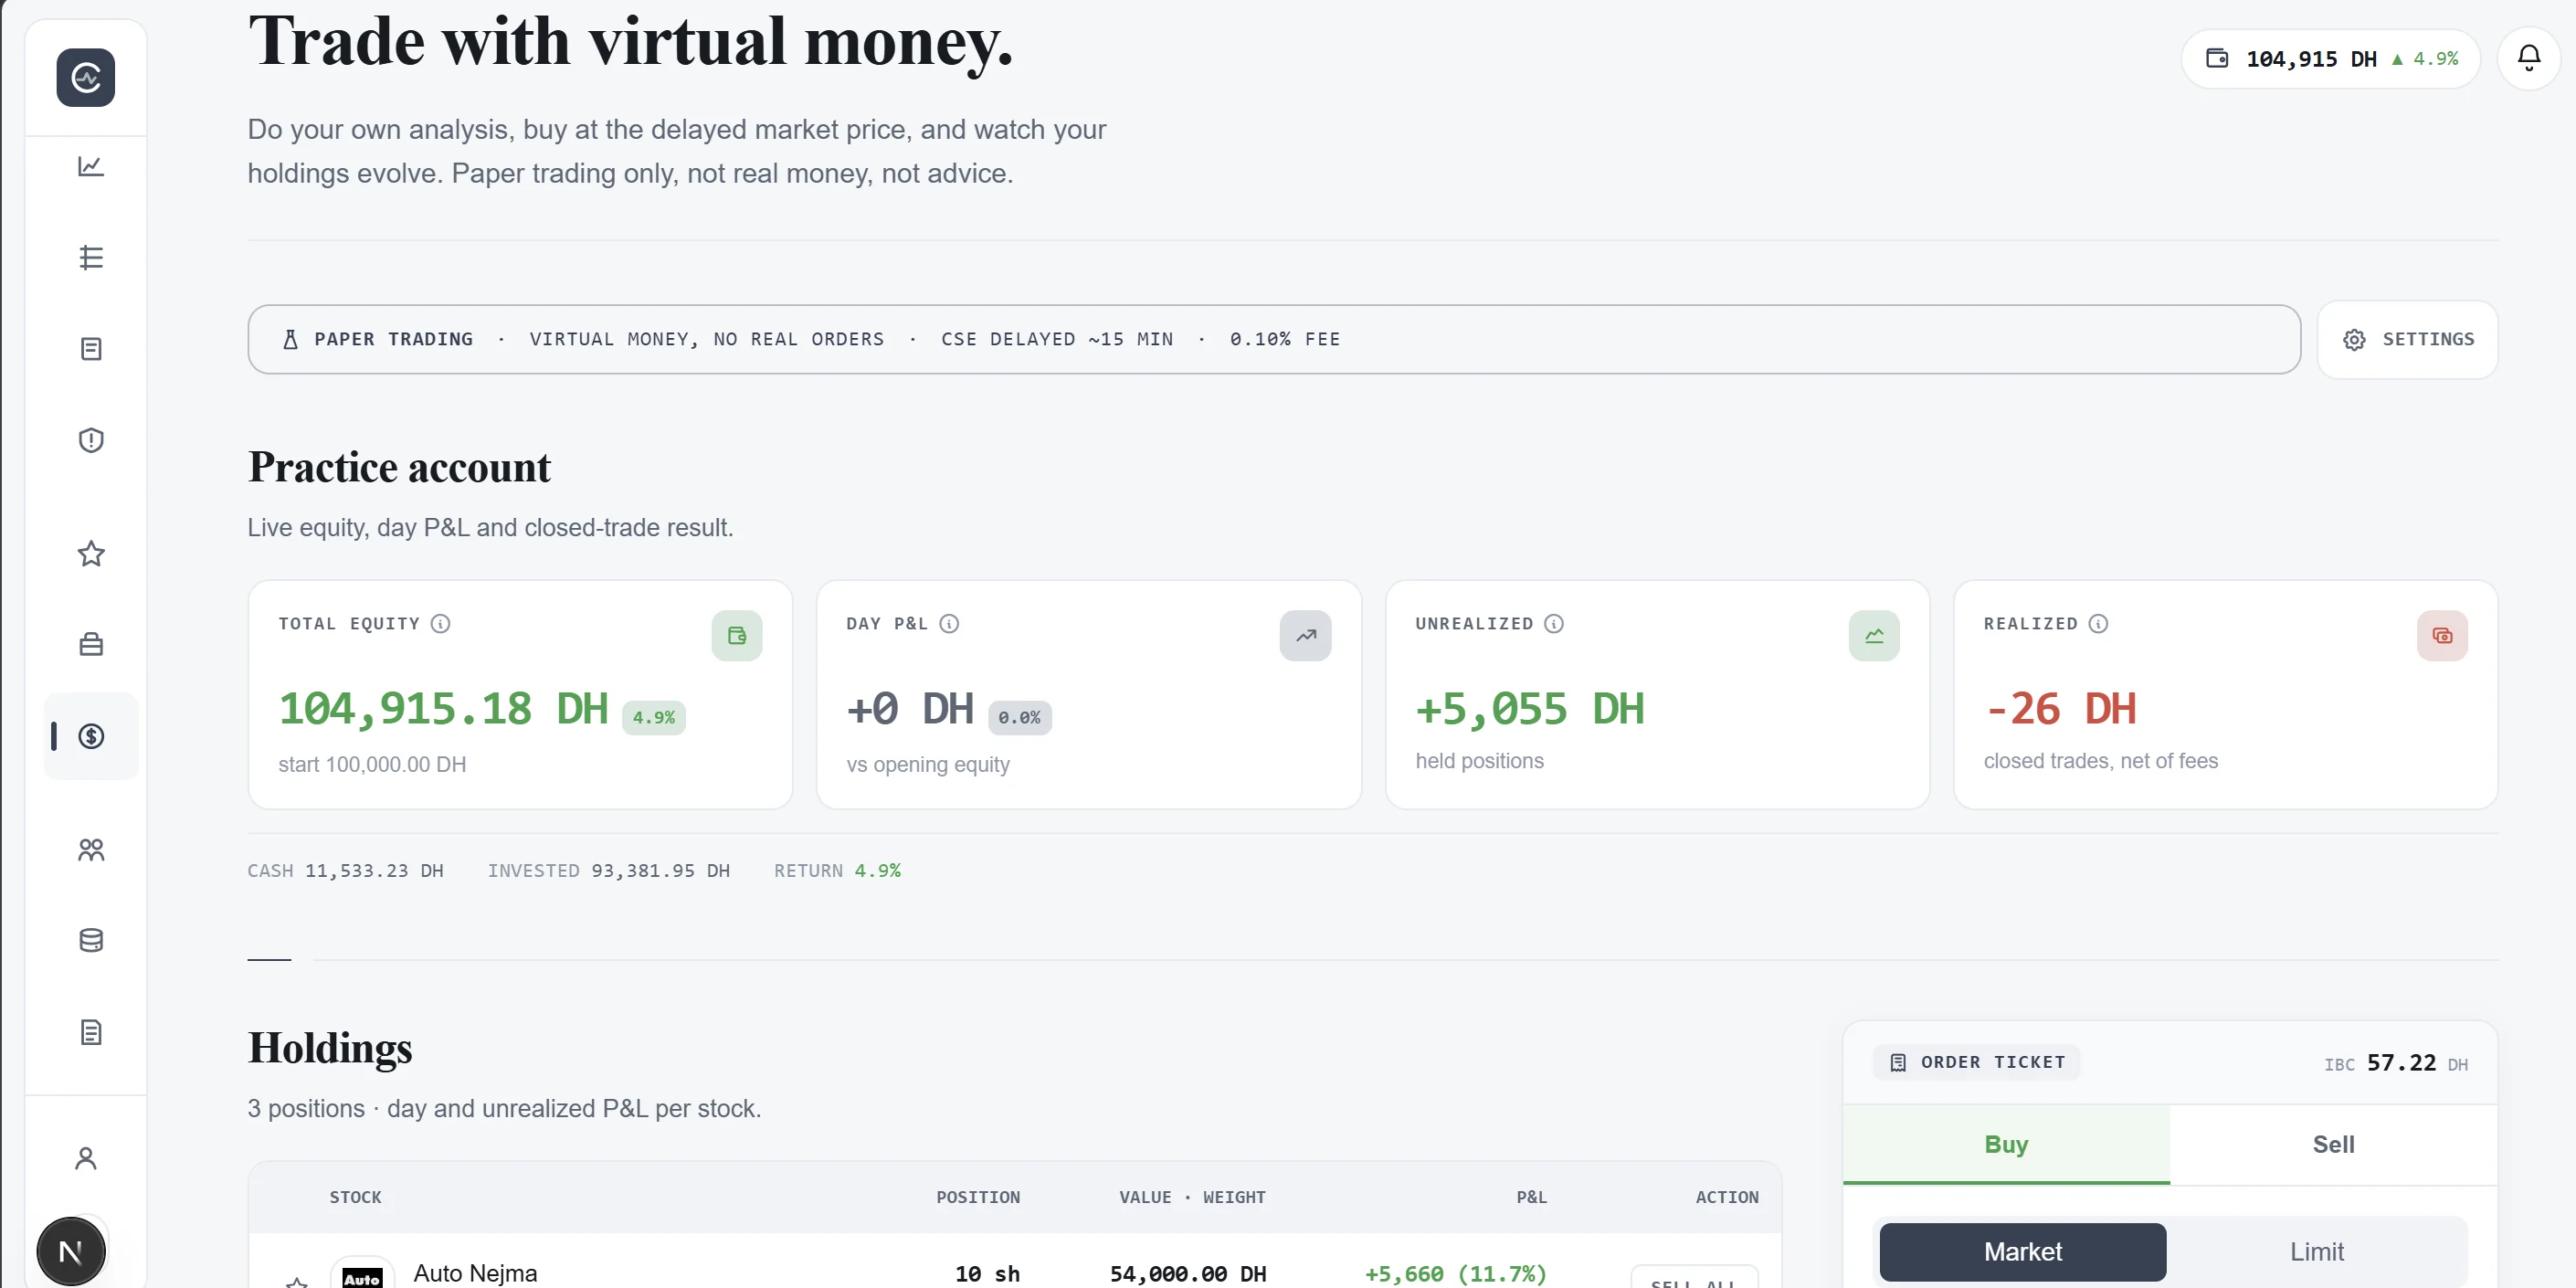
Lets users test their own analysis with virtual money, delayed prices, and explicit transaction costs.
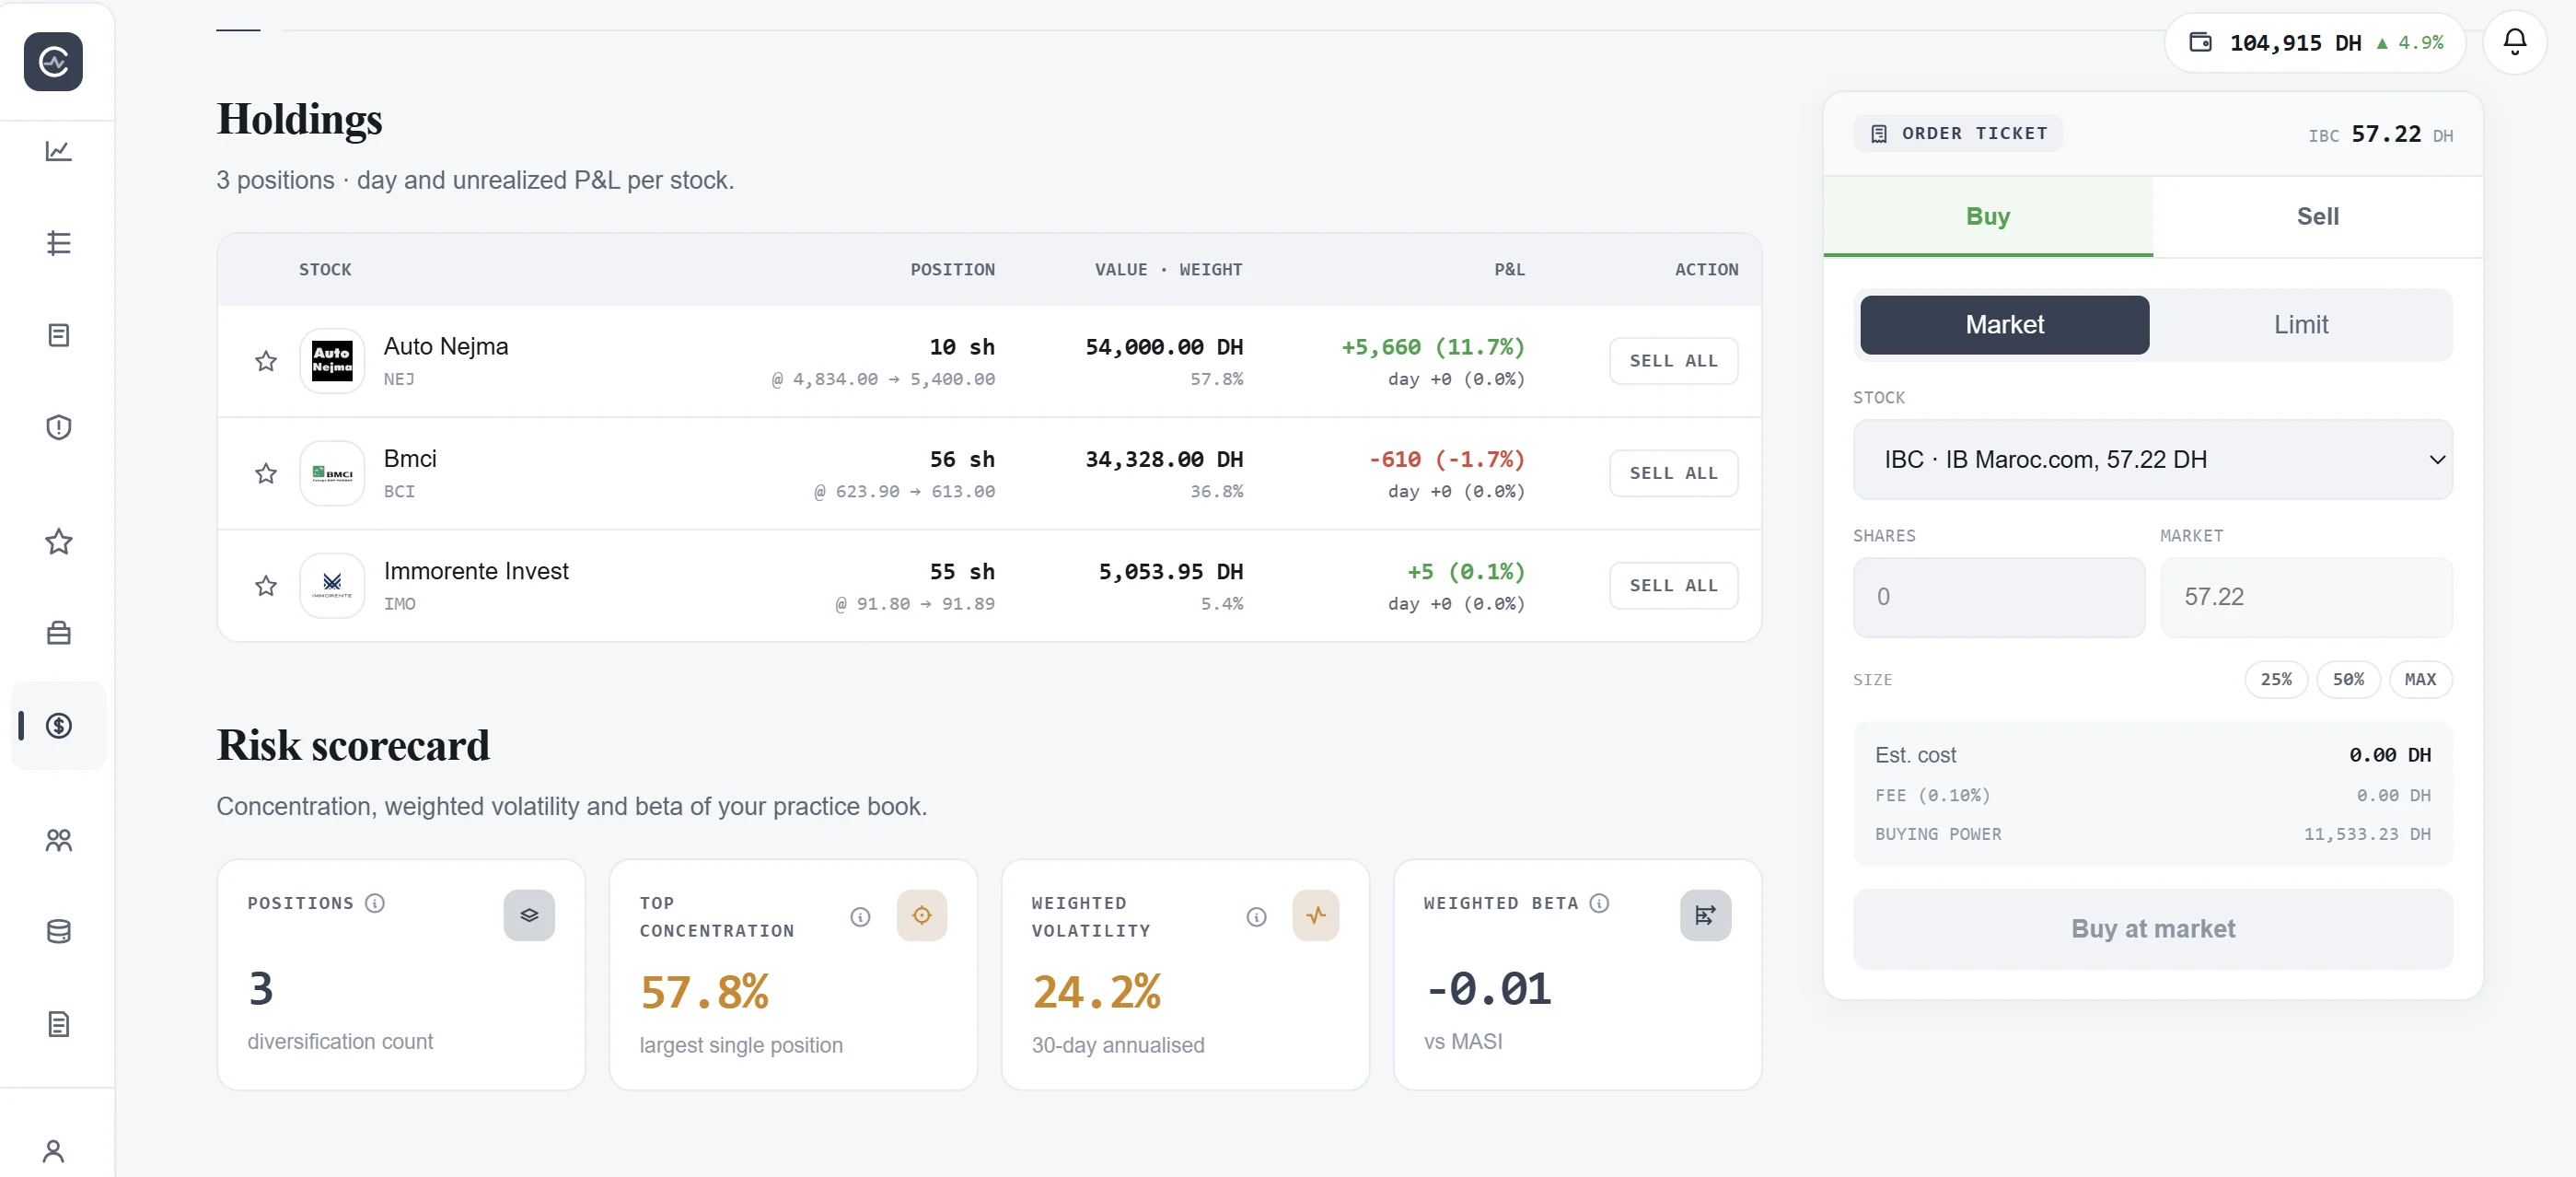
Connects position-level P&L with portfolio concentration, weighted volatility, and beta.
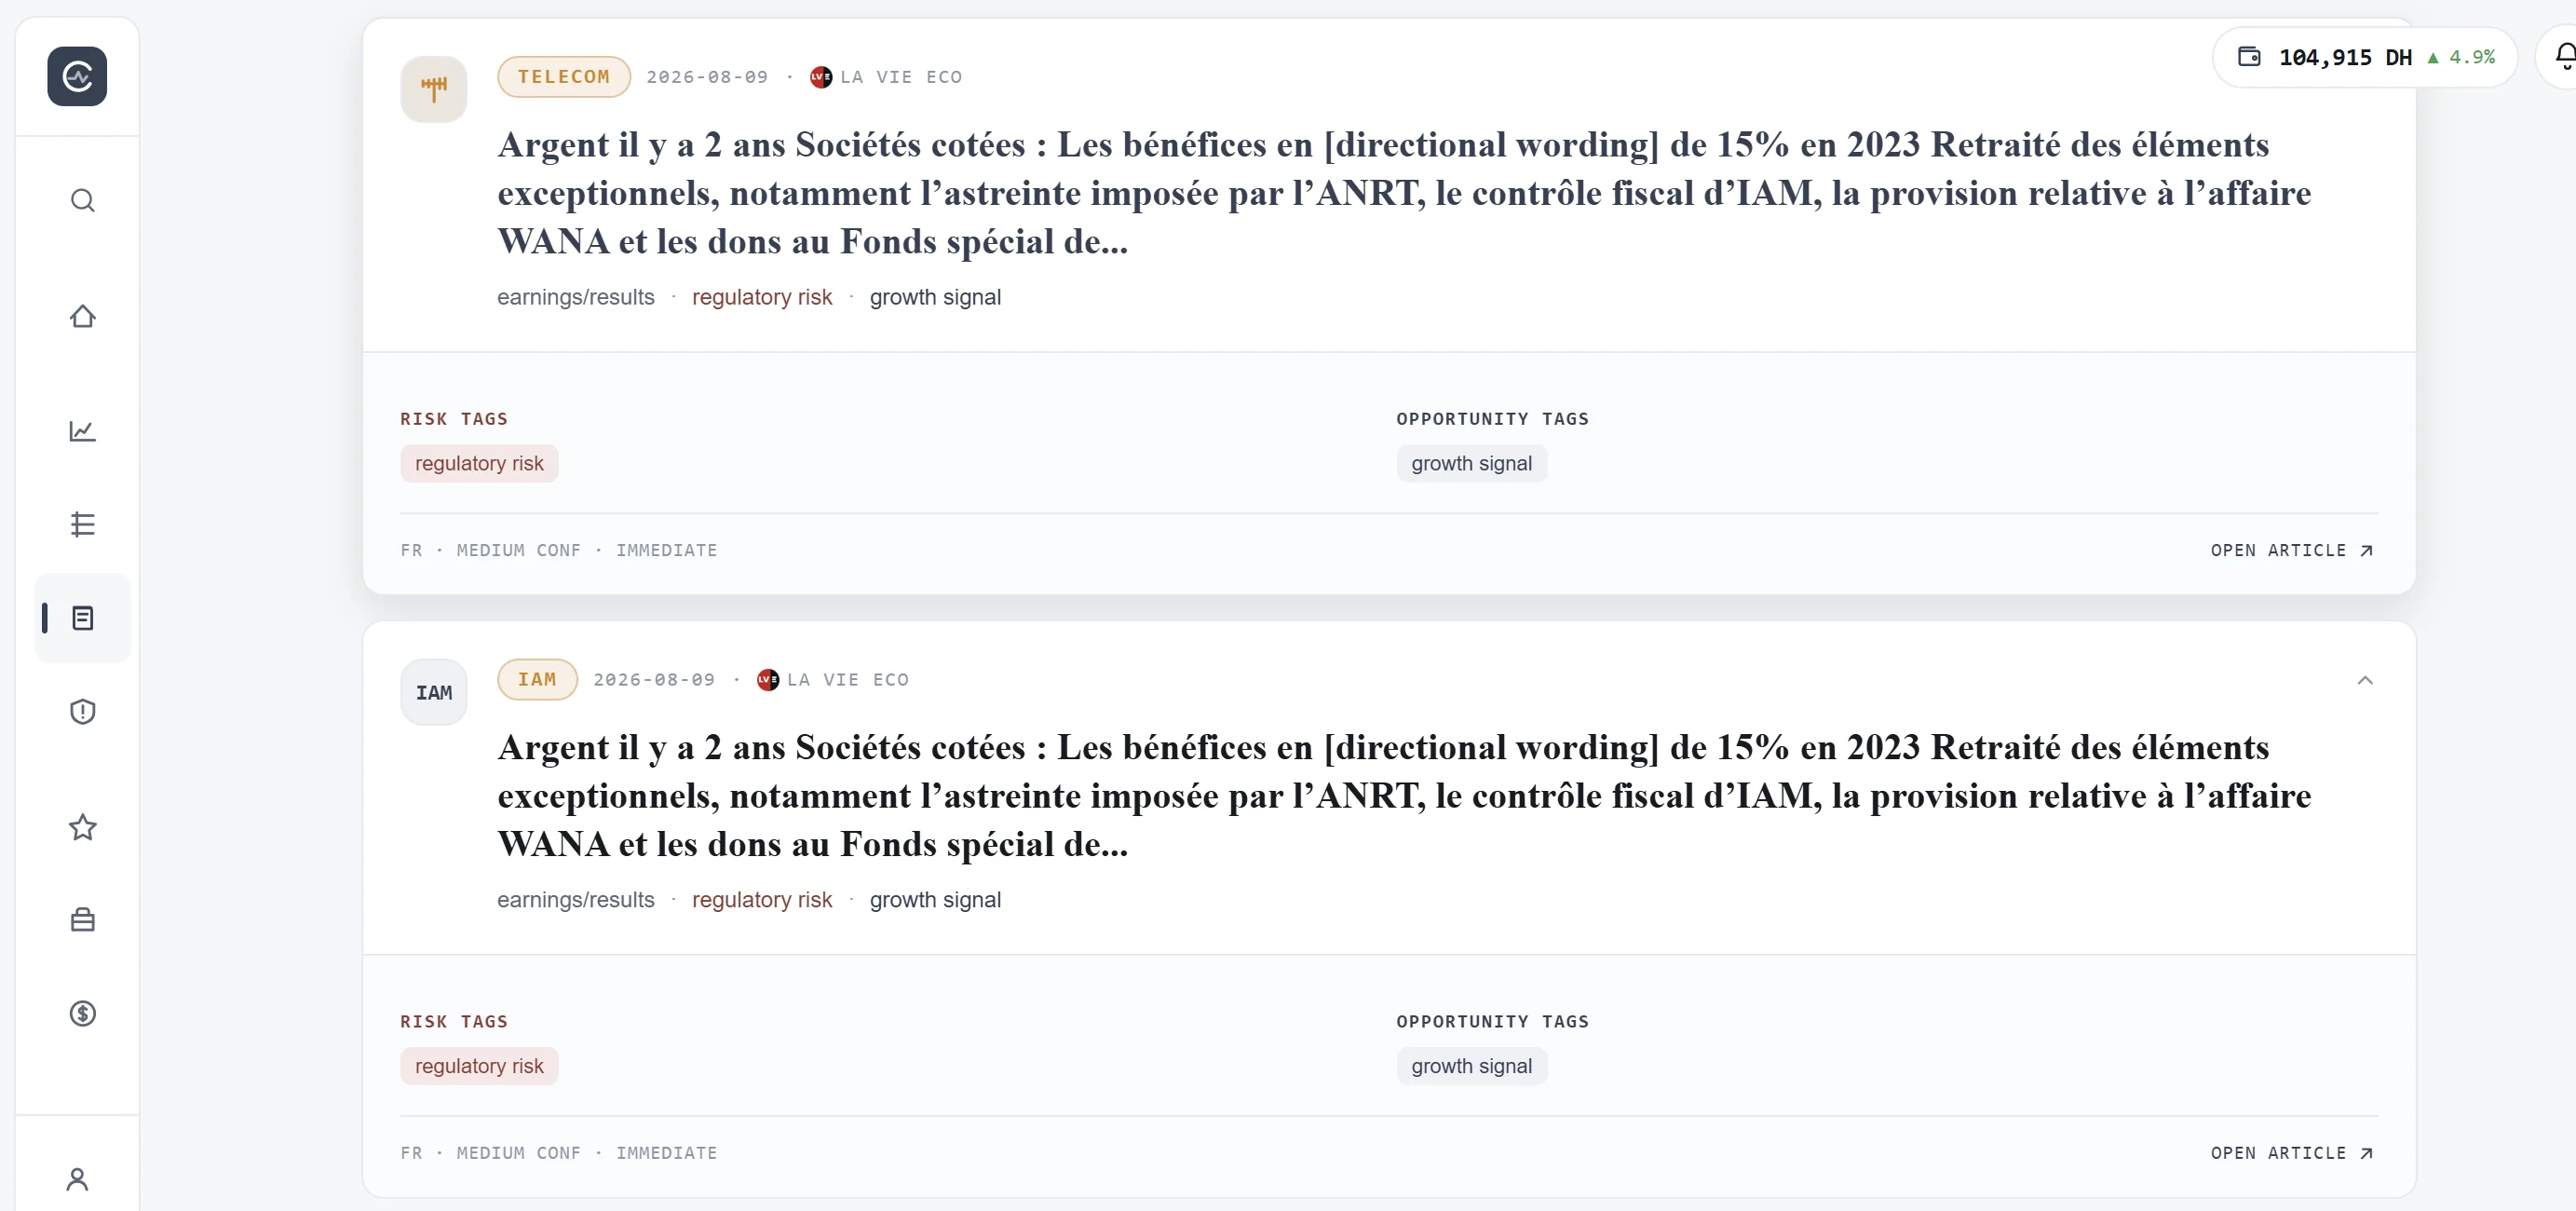
Expands each article into traceable risk and opportunity tags with source and confidence context.