Situation
Revenue, customer, product, billing, and support data lived in eight disconnected operational tables, leaving no shared, trustworthy KPI layer for different stakeholders to make decisions from.
Data Analytics
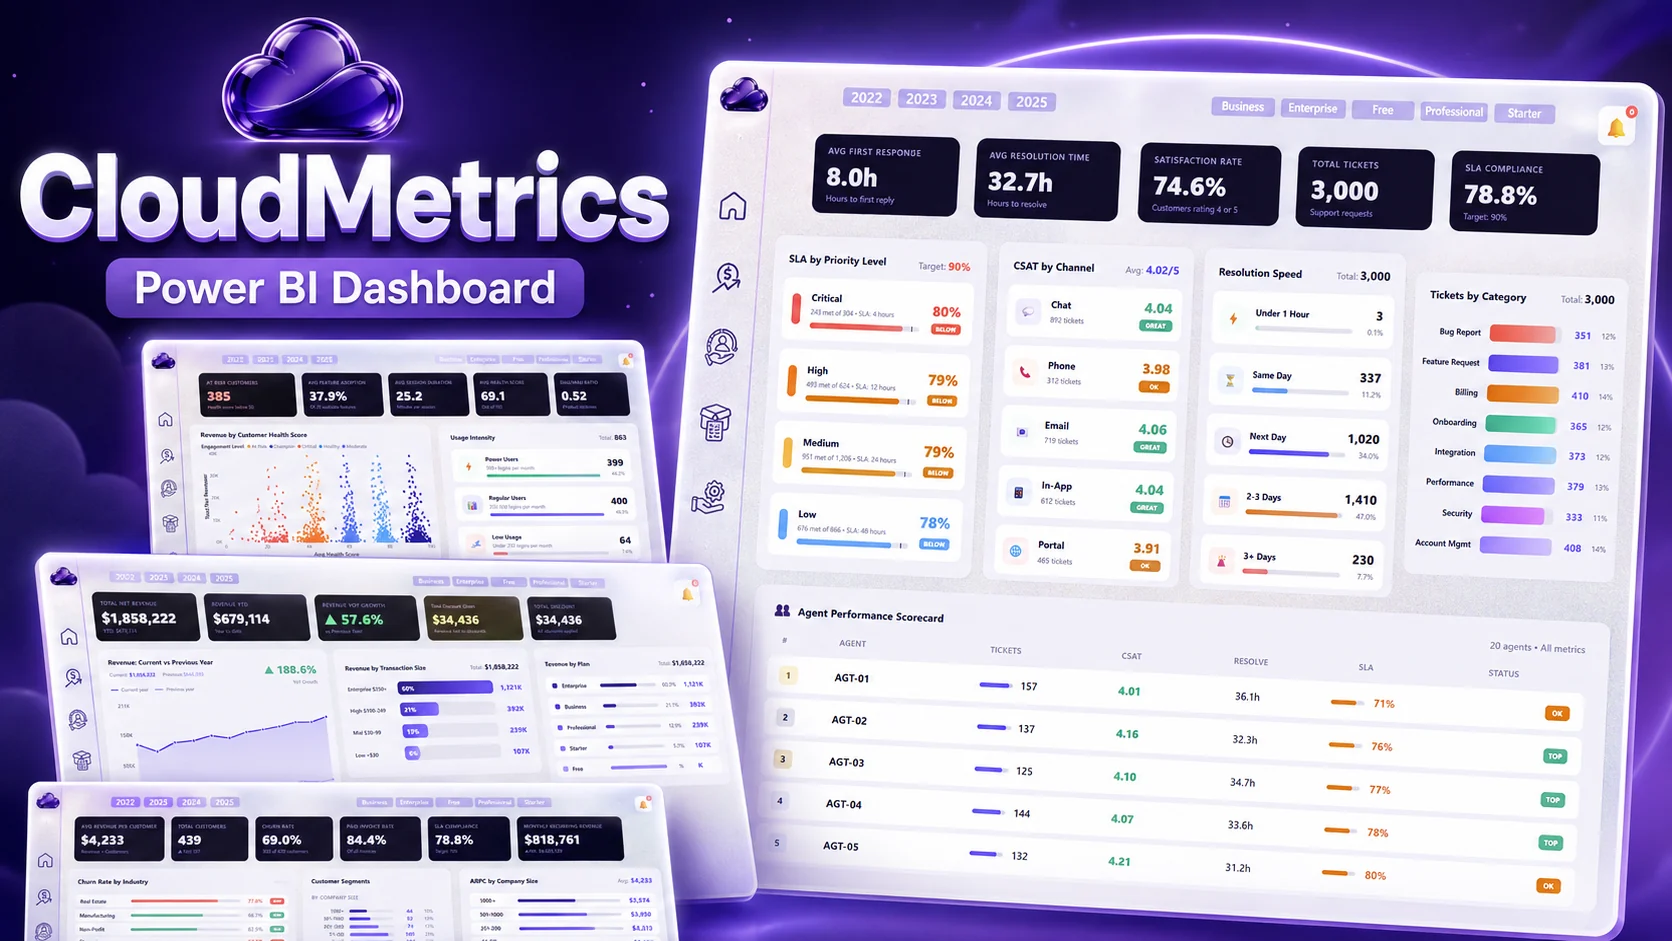
A five-page Power BI decision system built from eight connected tables, combining revenue, customer health, product usage, billing, and support performance.
Why it matters
My role
Revenue, customer, product, billing, and support data lived in eight disconnected operational tables, leaving no shared, trustworthy KPI layer for different stakeholders to make decisions from.
Build a five-page Power BI decision system on a governed data model, so executive, finance, customer-success, product, and support teams calculate from the same numbers instead of reconciling conflicting reports.
Five role-specific pages connect commercial, customer, product, billing, and support evidence with drill-down paths from executive KPIs to operational drivers, giving each audience the few metrics that actually drive its decisions: revenue leakage, at-risk customers, engagement, and support delivery.
Technical implementation
Each layer connects an implementation choice to the decision or workflow it supports.
06 layers| Layer | Implementation | Operational purpose |
|---|---|---|
| Source preparation | Eight operational tables processed through more than 25 Power Query transformations | Standardize types, keys, missing values and business-ready fields |
| Analytical model | Star schema with shared dimensions, controlled relationships and a reusable date table | Keep every report page on one consistent analytical foundation |
| Metric layer | More than 30 governed DAX measures for MRR, churn, health, adoption, CSAT and SLA | Create reusable KPI definitions that respond correctly to filter context |
| Time intelligence | Prior-period and year-over-year logic including SAMEPERIODLASTYEAR | Replace manually maintained comparisons with repeatable period analysis |
| Validation | Relationship, total, blank, filter and period-comparison checks | Verify business logic before presenting polished visuals |
| Decision views | Five pages tailored to executive, finance, customer, product and support questions | Move each stakeholder from headline KPI to the driver requiring action |
Product walkthrough
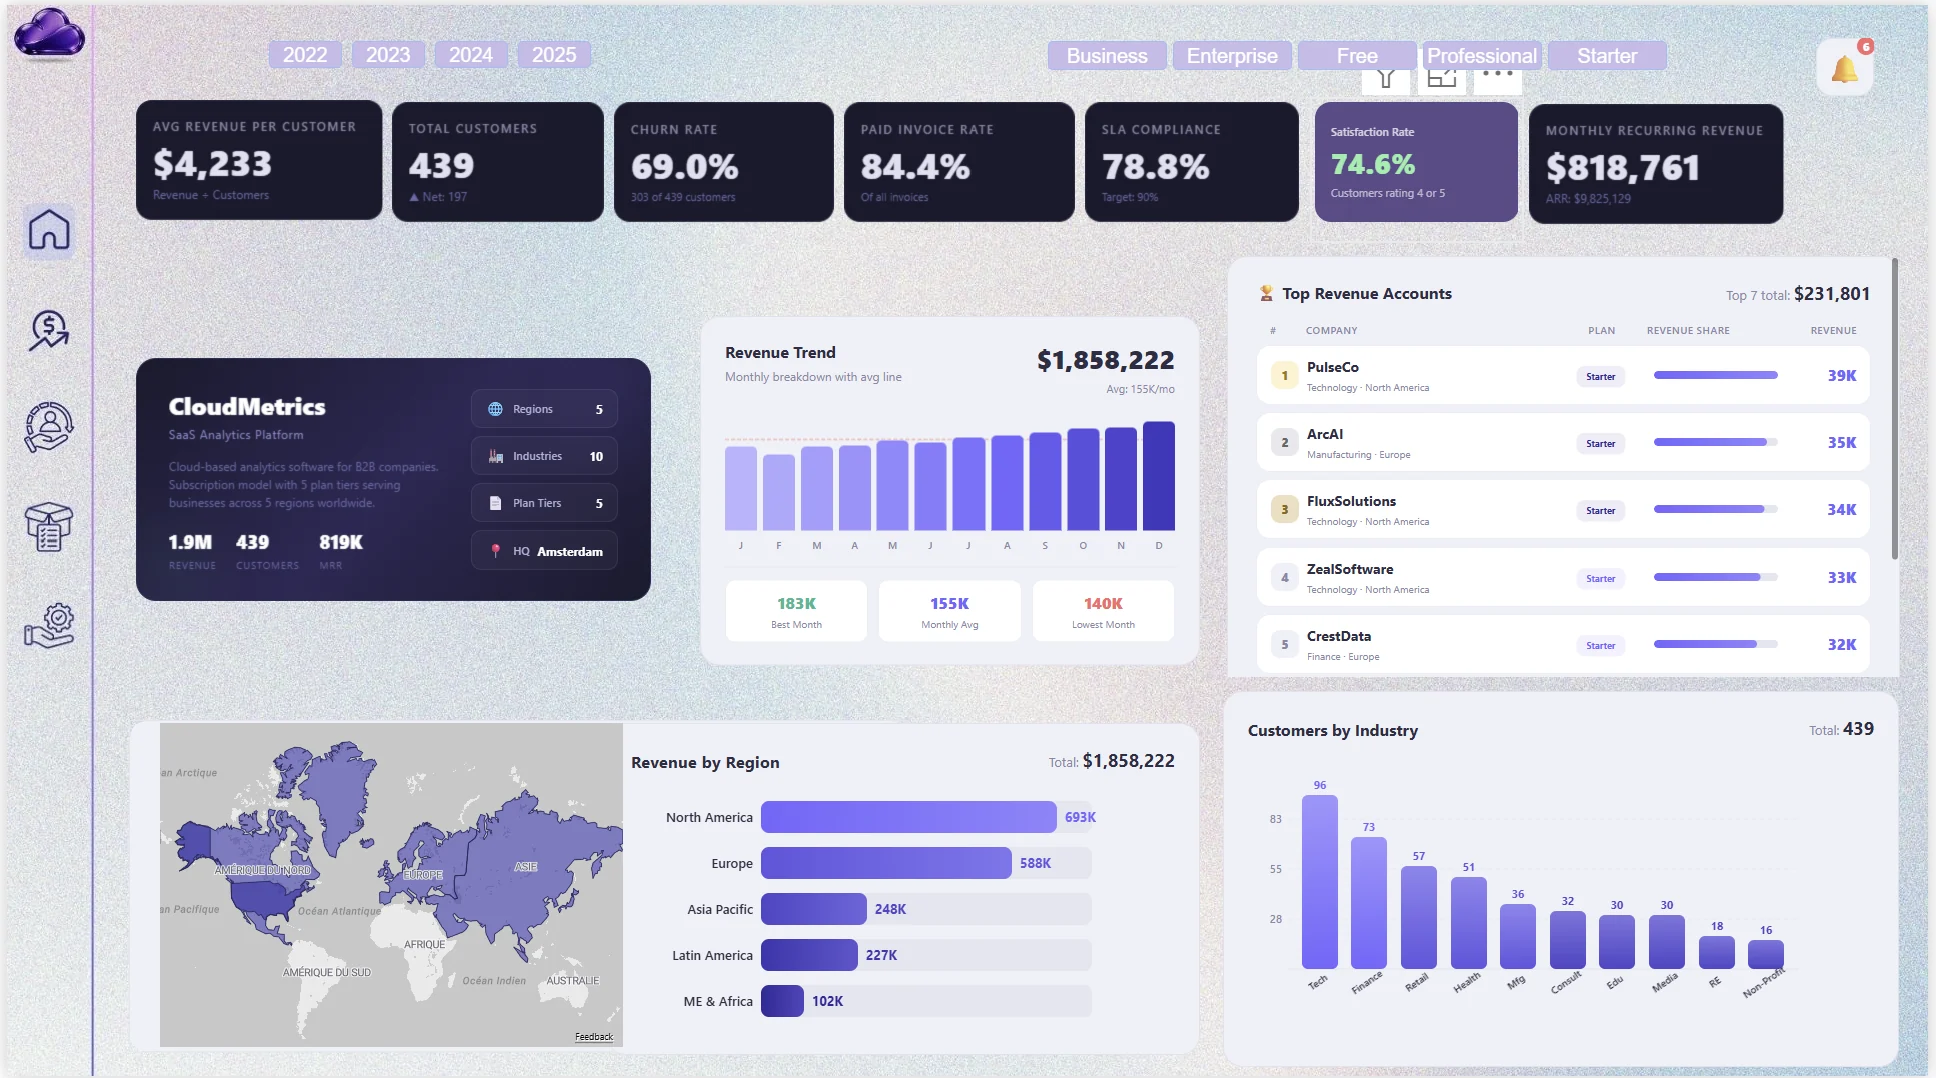
Presents leadership with the essential business-health indicators in a ten-second view.
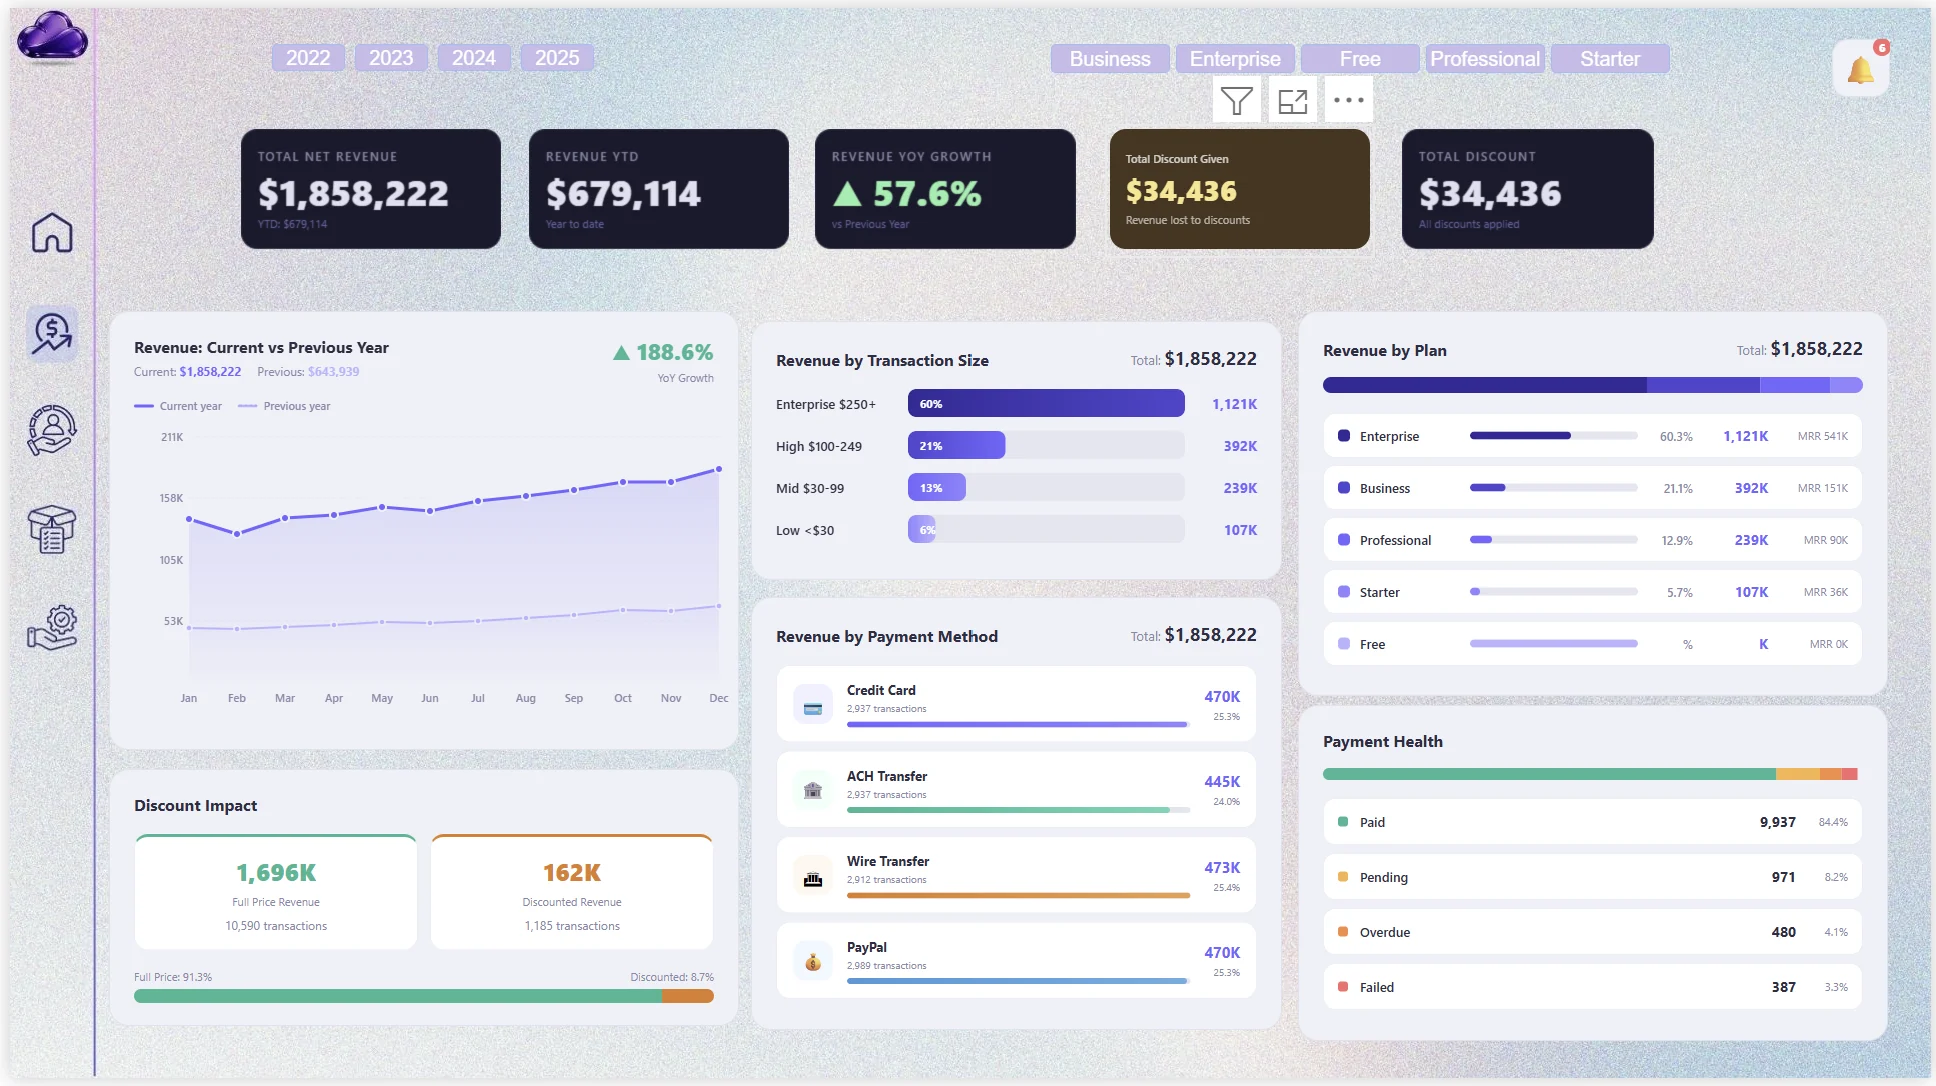
Connects recurring revenue, growth, discounts, billing health, and year-over-year movement.
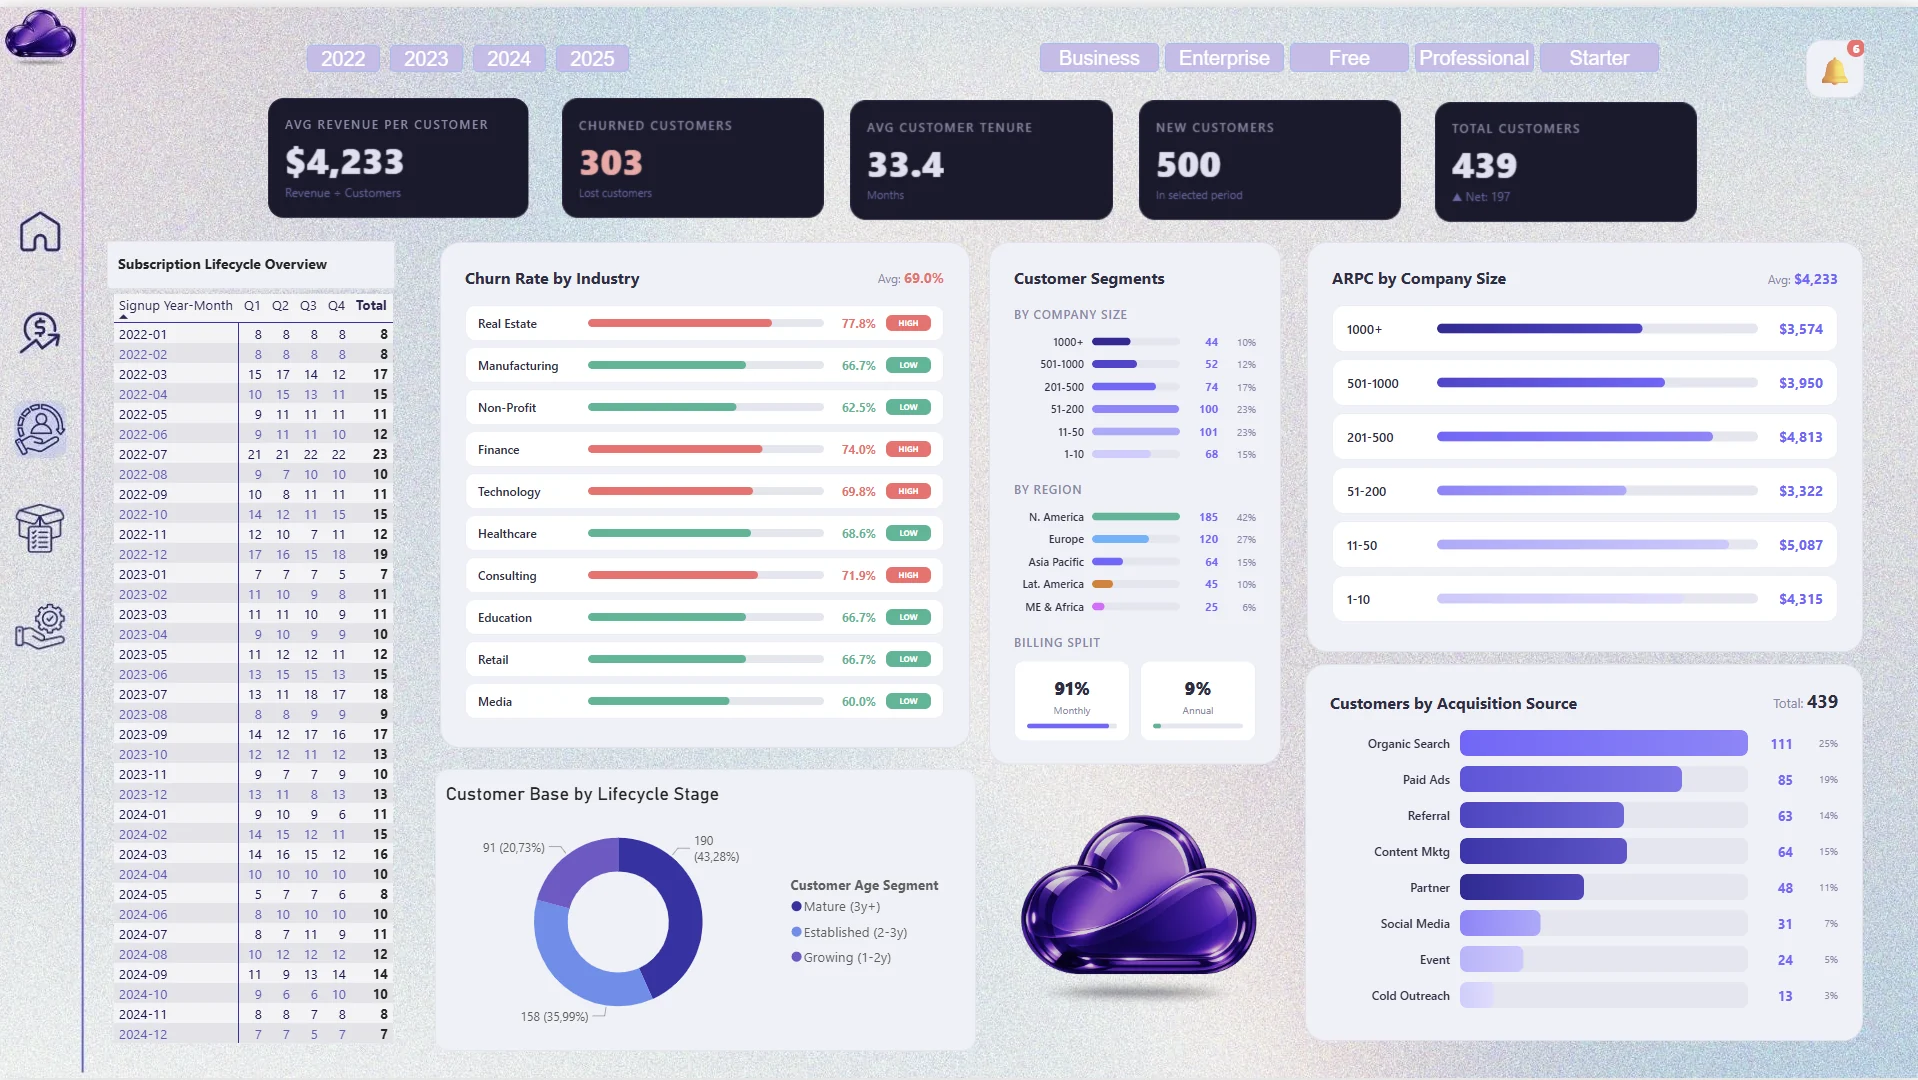
Surfaces retention, cohort behaviour, churn exposure, and customers requiring attention.
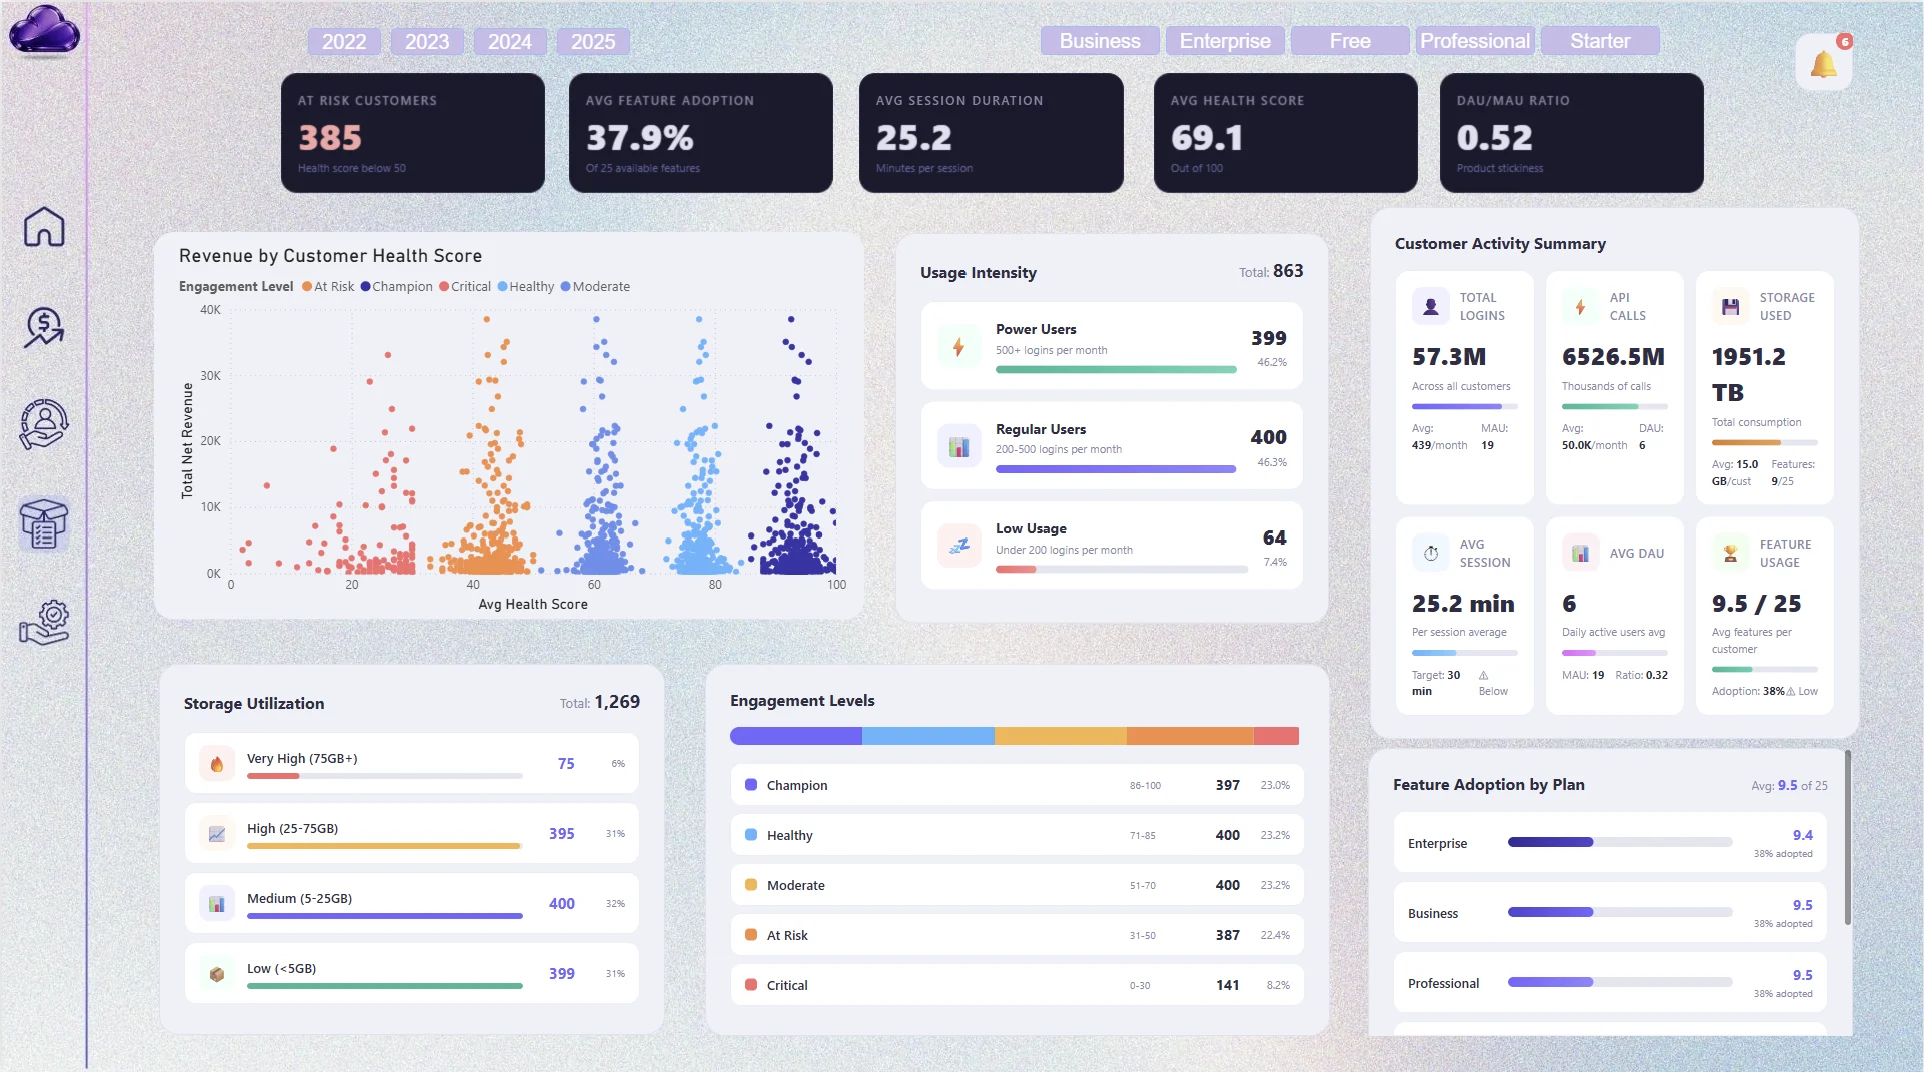
Relates product adoption and engagement to account health and retention risk.
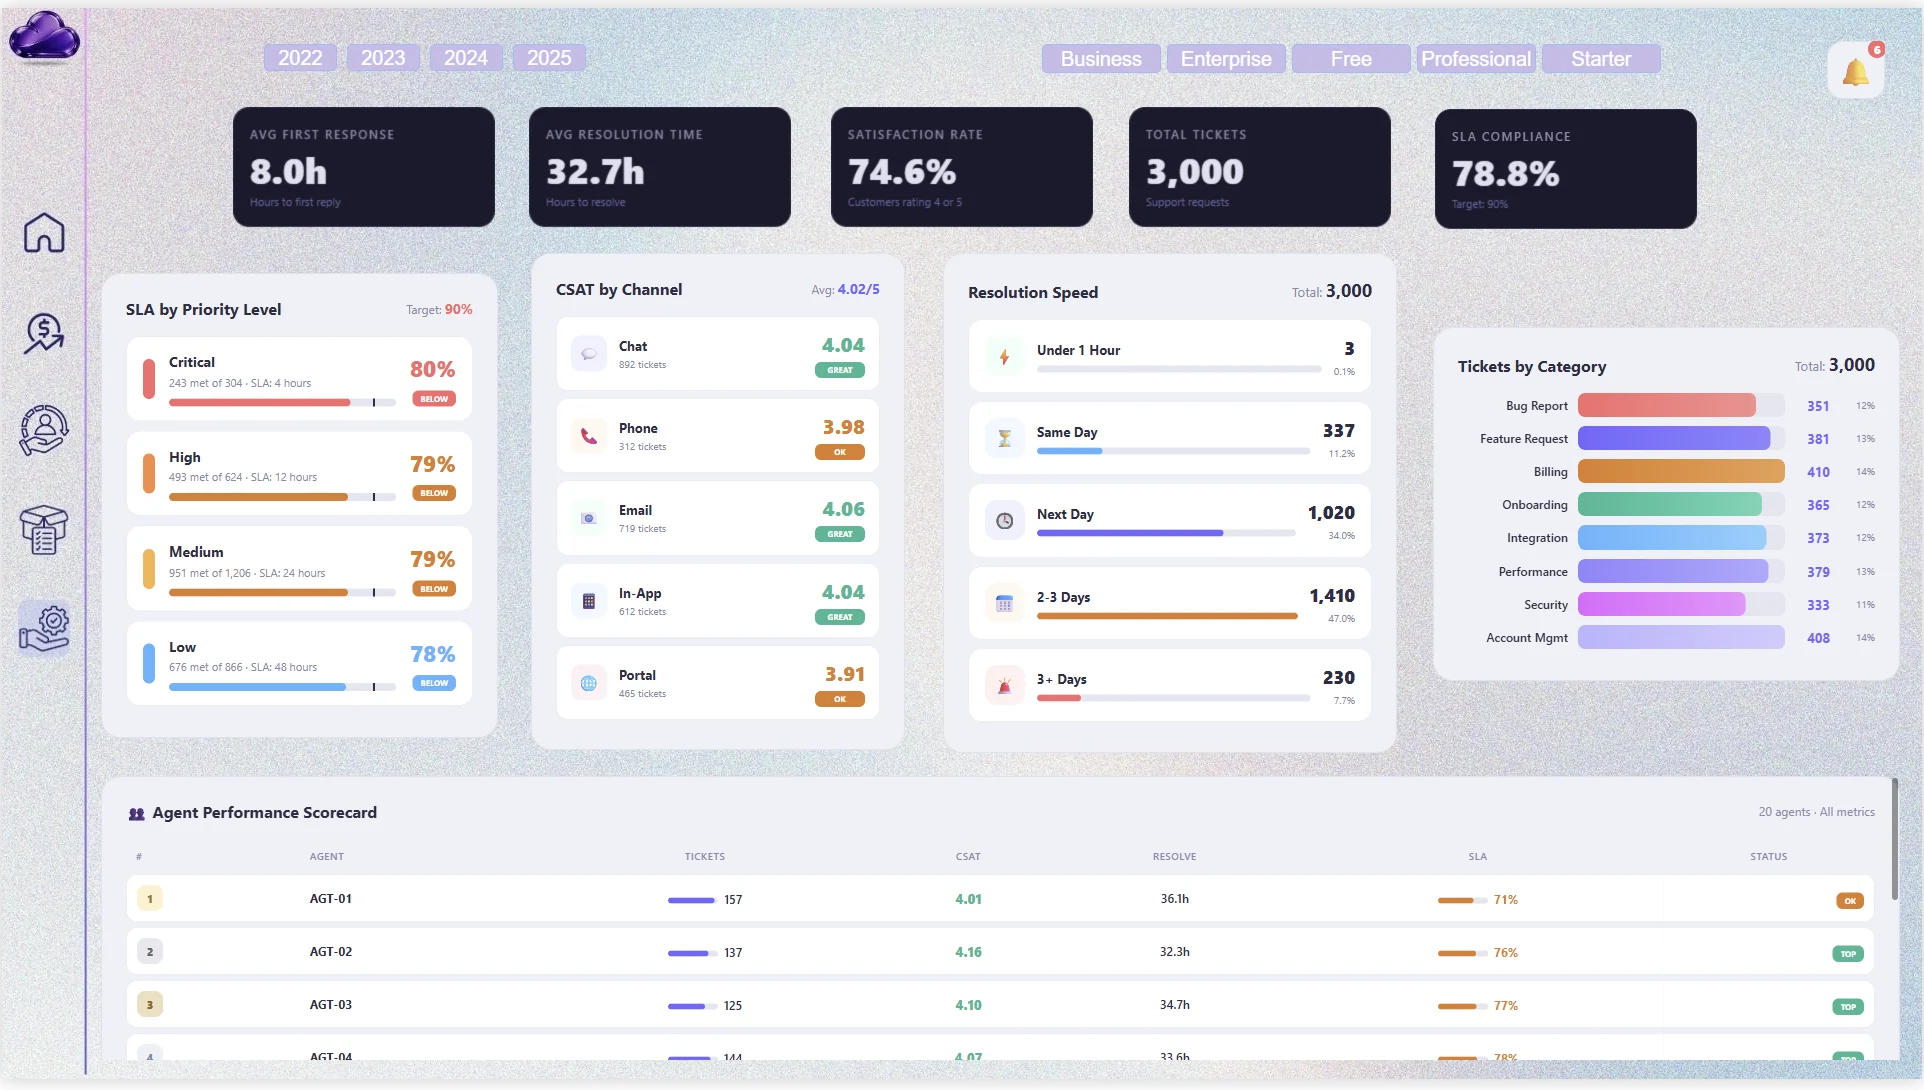
Tracks service delivery through SLA compliance, response performance, workload, and satisfaction.
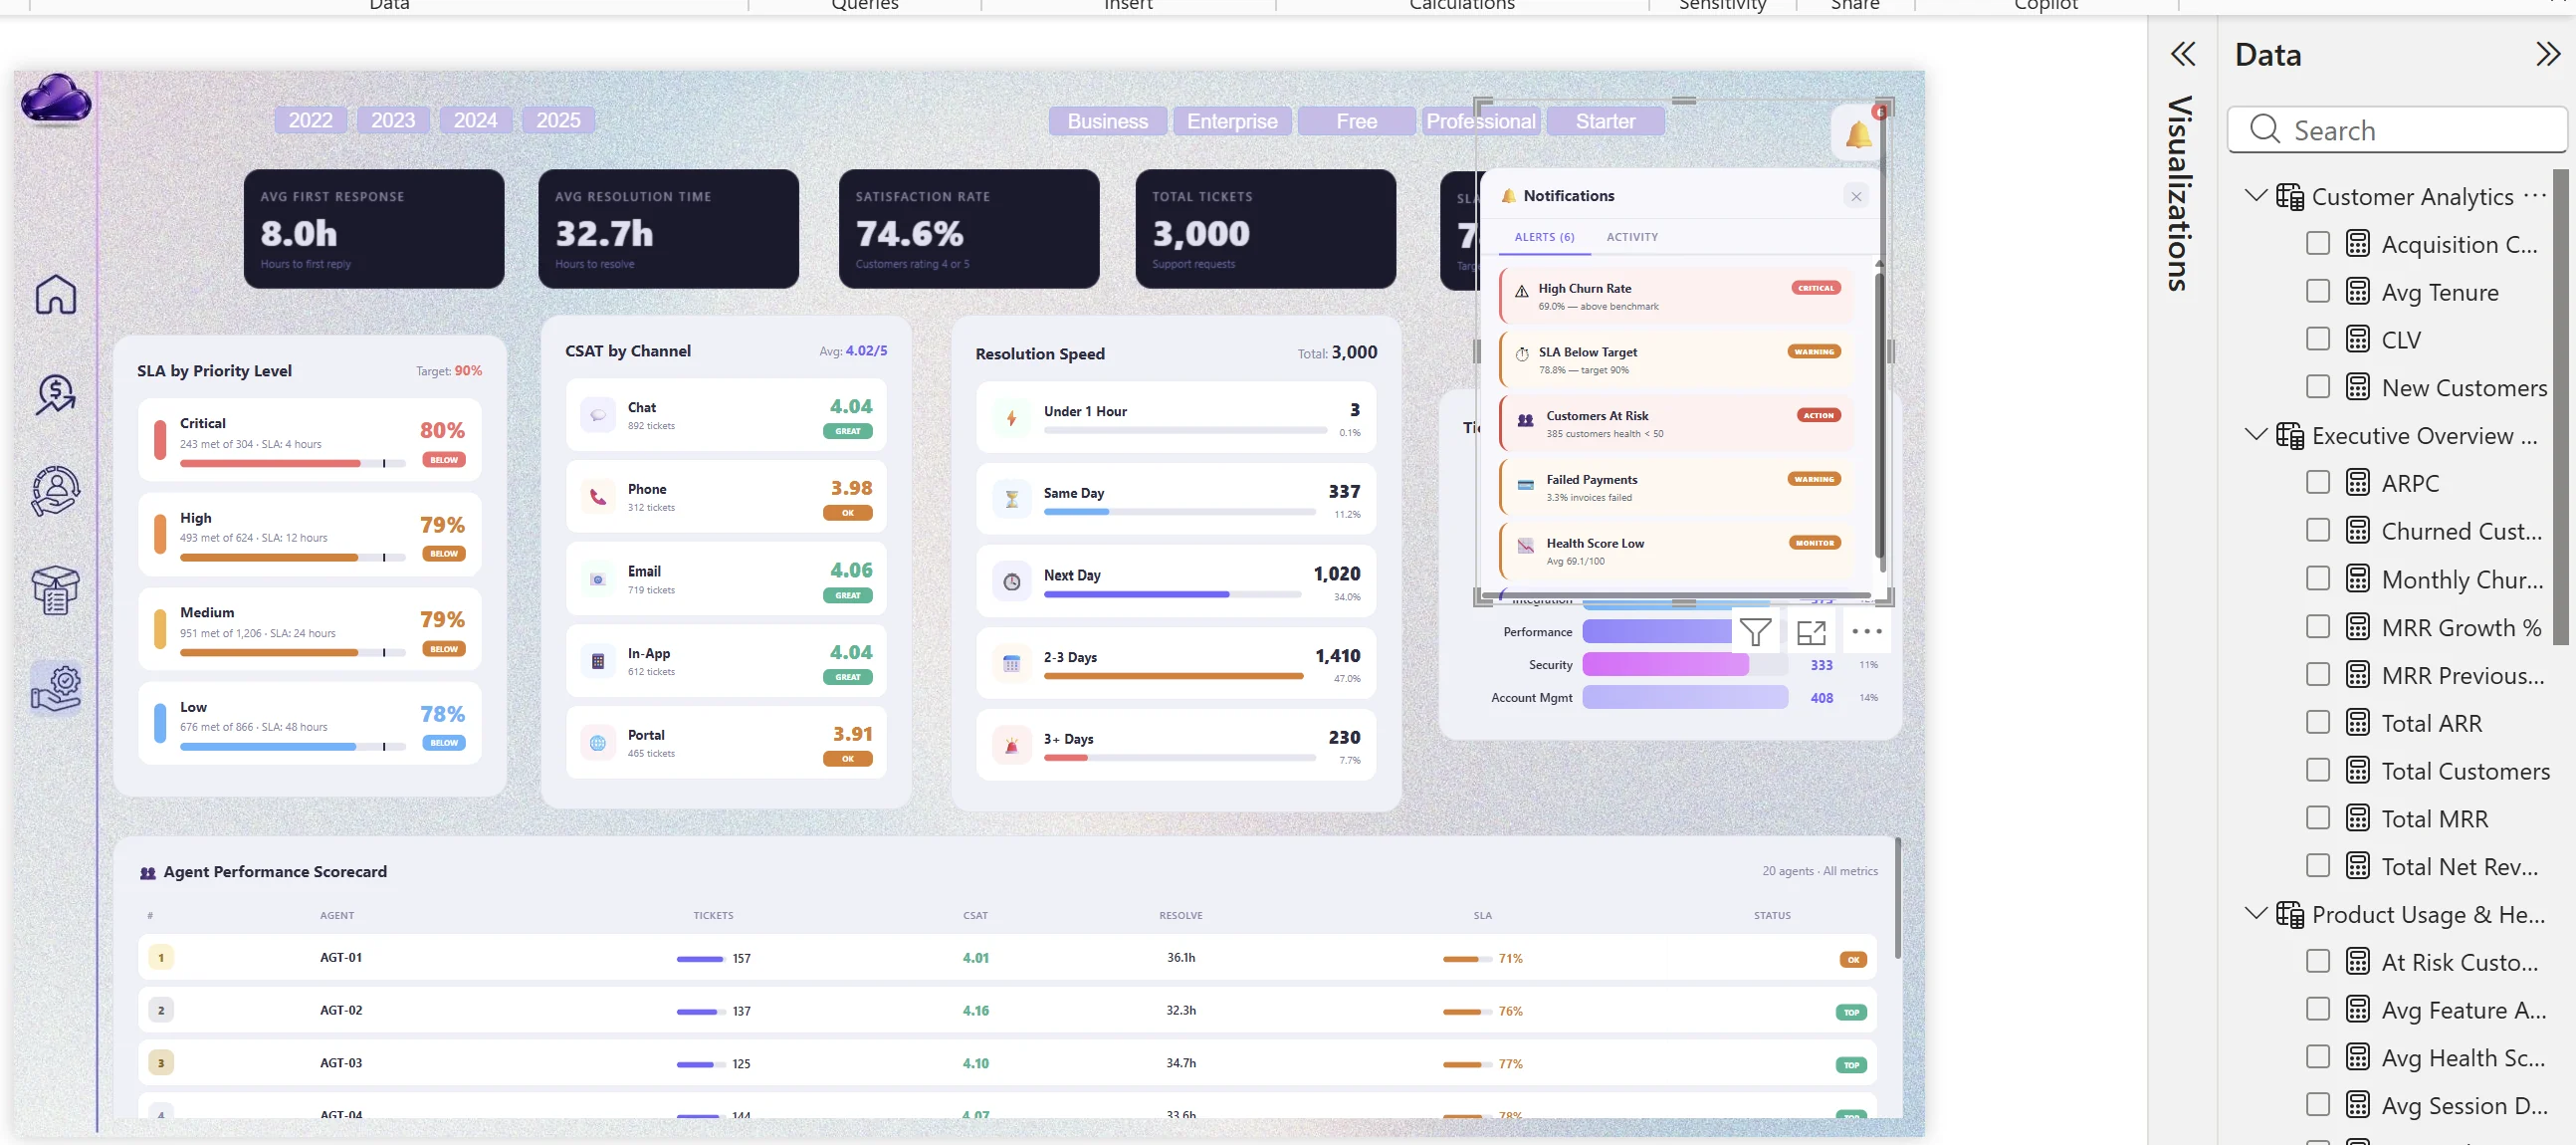
Shows how threshold-based alerts are authored directly inside the Power BI report.